

Market Economics | Interest Rate Strategy - BNP PARIBAS ...
Market Economics | Interest Rate Strategy - BNP PARIBAS ...
Market Economics | Interest Rate Strategy - BNP PARIBAS ...

Create successful ePaper yourself
Turn your PDF publications into a flip-book with our unique Google optimized e-Paper software.
US: Corporate Issuance and Swap Spreads<br />
• Summer doldrums: USD high grade<br />
corporate bond issuance tends to be lowest in<br />
the months of July and August, averaging USD<br />
48bn (5.6%) and USD 58bn (6.7% of total<br />
issuance for the year), respectively, over the<br />
past five years (Chart 3). Despite predictions<br />
by some analysts of an increase in corporate<br />
issuance for the summer of 2010, July<br />
issuance so far is right on trend at USD 33<br />
billion, and will likely slow through the<br />
remainder of the month as US earnings season<br />
enters high gear.<br />
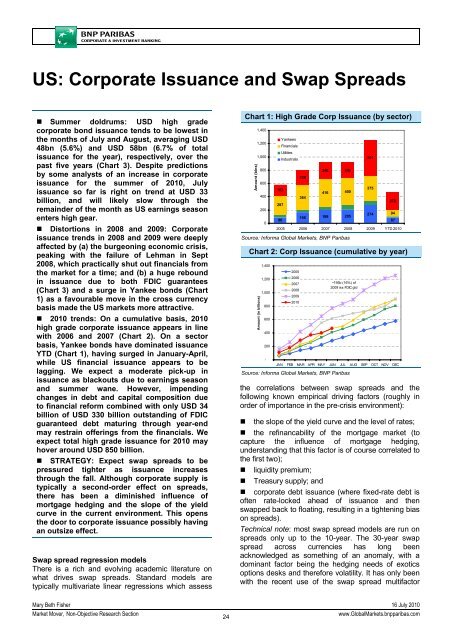
• Distortions in 2008 and 2009: Corporate<br />
issuance trends in 2008 and 2009 were deeply<br />
affected by (a) the burgeoning economic crisis,<br />
peaking with the failure of Lehman in Sept<br />
2008, which practically shut out financials from<br />
the market for a time; and (b) a huge rebound<br />
in issuance due to both FDIC guarantees<br />
(Chart 3) and a surge in Yankee bonds (Chart<br />
1) as a favourable move in the cross currency<br />
basis made the US markets more attractive.<br />
• 2010 trends: On a cumulative basis, 2010<br />
high grade corporate issuance appears in line<br />
with 2006 and 2007 (Chart 2). On a sector<br />
basis, Yankee bonds have dominated issuance<br />
YTD (Chart 1), having surged in January-April,<br />
while US financial issuance appears to be<br />
lagging. We expect a moderate pick-up in<br />
issuance as blackouts due to earnings season<br />
and summer wane. However, impending<br />
changes in debt and capital composition due<br />
to financial reform combined with only USD 34<br />
billion of USD 330 billion outstanding of FDIC<br />
guaranteed debt maturing through year-end<br />
may restrain offerings from the financials. We<br />
expect total high grade issuance for 2010 may<br />
hover around USD 850 billion.<br />
• STRATEGY: Expect swap spreads to be<br />
pressured tighter as issuance increases<br />
through the fall. Although corporate supply is<br />
typically a second-order effect on spreads,<br />
there has been a diminished influence of<br />
mortgage hedging and the slope of the yield<br />
curve in the current environment. This opens<br />
the door to corporate issuance possibly having<br />
an outsize effect.<br />
Swap spread regression models<br />
There is a rich and evolving academic literature on<br />
what drives swap spreads. Standard models are<br />
typically multivariate linear regressions which assess<br />
Chart 1: High Grade Corp Issuance (by sector)<br />
Amount (blns)<br />
1,400<br />
1,200<br />
1,000<br />
800<br />
600<br />
400<br />
200<br />
0<br />
163<br />
287<br />
86<br />
Yankees<br />
Financials<br />
Utilities<br />
Industrials<br />
238<br />
364<br />
248 242<br />
416 400<br />
166 199 205<br />
the correlations between swap spreads and the<br />
following known empirical driving factors (roughly in<br />
order of importance in the pre-crisis environment):<br />
• the slope of the yield curve and the level of rates;<br />
• the refinancability of the mortgage market (to<br />
capture the influence of mortgage hedging,<br />
understanding that this factor is of course correlated to<br />
the first two);<br />
• liquidity premium;<br />
• Treasury supply; and<br />
• corporate debt issuance (where fixed-rate debt is<br />
often rate-locked ahead of issuance and then<br />
swapped back to floating, resulting in a tightening bias<br />
on spreads).<br />
Technical note: most swap spread models are run on<br />
spreads only up to the 10-year. The 30-year swap<br />
spread across currencies has long been<br />
acknowledged as something of an anomaly, with a<br />
dominant factor being the hedging needs of exotics<br />
options desks and therefore volatility. It has only been<br />
with the recent use of the swap spread multifactor<br />
541<br />
375<br />
274<br />
270<br />
94<br />
87<br />
2005 2006 2007 2008 2009 YTD 2010<br />
Source: Informa Global <strong>Market</strong>s, <strong>BNP</strong> Paribas<br />
Chart 2: Corp Issuance (cumulative by year)<br />
Amount (in billions)<br />
1,400<br />
1,200<br />
1,000<br />
800<br />
600<br />
400<br />
200<br />
-<br />
2005<br />
2006<br />
2007<br />
2008<br />
2009<br />
2010<br />
~195b (16%) of<br />
2009 iss FDIC gtd<br />
JAN FEB MA R APR MAY JUN JUL AUG SEP OCT NOV DEC<br />
Source: Informa Global <strong>Market</strong>s, <strong>BNP</strong> Paribas<br />
Mary Beth Fisher 16 July 2010<br />
<strong>Market</strong> Mover, Non-Objective Research Section<br />
24<br />
www.Global<strong>Market</strong>s.bnpparibas.com


