

Market Economics | Interest Rate Strategy - BNP PARIBAS ...
Market Economics | Interest Rate Strategy - BNP PARIBAS ...
Market Economics | Interest Rate Strategy - BNP PARIBAS ...

Create successful ePaper yourself
Turn your PDF publications into a flip-book with our unique Google optimized e-Paper software.
EUR: Yet Another Volatility Deflation Trade<br />
• With the exception of severe dislocations at<br />
the height of the credit crisis, the 10y10y skew<br />
has undergone flattening and steepening<br />
pressures with rising rates and falling rates,<br />
respectively.<br />
• STRATEGY: Buy the EUR 10y10y<br />
3.50%-2.75%-1.00% swaption receiver ladder.<br />
Historically, there has been a negative relationship<br />
between the steepness of the swaption implied<br />
volatility skew and the level of rates. This makes<br />
intuitive sense: everything else being equal, at higher<br />
levels of rates, deep out-of-the-money swaption<br />
receivers are more attractive than deep out-of-themoney<br />
payers. The opposite holds when rates are<br />
low.<br />
2.0<br />
2.5<br />
3.0<br />
3.5<br />
4.0<br />
4.5<br />
5.0<br />
5.5<br />
Chart 1: Evolution of EUR 10y10y Pay/Rec<br />
Implied Volatility Spread<br />
10y swap<br />
6.0<br />
2003 2004 2005 2006 2007 2008 2009 2010<br />
Source: <strong>BNP</strong> Paribas<br />
200bp out Pay/Rec Implied Volatility Spread (RHS)<br />
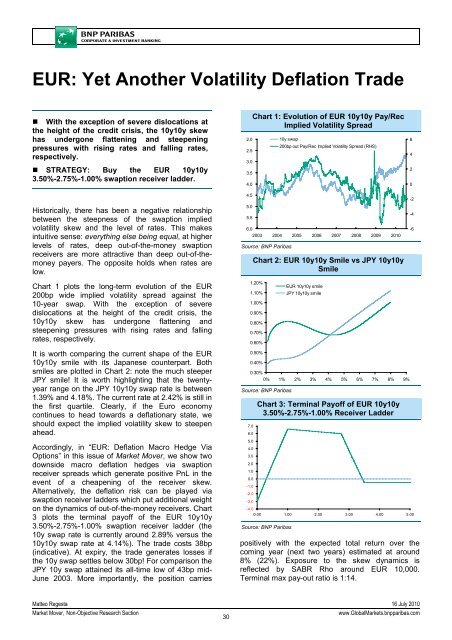
Chart 2: EUR 10y10y Smile vs JPY 10y10y<br />
Smile<br />
6<br />
4<br />
2<br />
0<br />
-2<br />
-4<br />
-6<br />
Chart 1 plots the long-term evolution of the EUR<br />
200bp wide implied volatility spread against the<br />
10-year swap. With the exception of severe<br />
dislocations at the height of the credit crisis, the<br />
10y10y skew has undergone flattening and<br />
steepening pressures with rising rates and falling<br />
rates, respectively.<br />
It is worth comparing the current shape of the EUR<br />
10y10y smile with its Japanese counterpart. Both<br />
smiles are plotted in Chart 2: note the much steeper<br />
JPY smile! It is worth highlighting that the twentyyear<br />
range on the JPY 10y10y swap rate is between<br />
1.39% and 4.18%. The current rate at 2.42% is still in<br />
the first quartile. Clearly, if the Euro economy<br />
continues to head towards a deflationary state, we<br />
should expect the implied volatility skew to steepen<br />
ahead.<br />
Accordingly, in “EUR: Deflation Macro Hedge Via<br />
Options” in this issue of <strong>Market</strong> Mover, we show two<br />
downside macro deflation hedges via swaption<br />
receiver spreads which generate positive PnL in the<br />
event of a cheapening of the receiver skew.<br />
Alternatively, the deflation risk can be played via<br />
swaption receiver ladders which put additional weight<br />
on the dynamics of out-of-the-money receivers. Chart<br />
3 plots the terminal payoff of the EUR 10y10y<br />
3.50%-2.75%-1.00% swaption receiver ladder (the<br />
10y swap rate is currently around 2.89% versus the<br />
10y10y swap rate at 4.14%). The trade costs 38bp<br />
(indicative). At expiry, the trade generates losses if<br />
the 10y swap settles below 30bp! For comparison the<br />
JPY 10y swap attained its all-time low of 43bp mid-<br />
June 2003. More importantly, the position carries<br />
1.20%<br />
1.10%<br />
1.00%<br />
0.90%<br />
0.80%<br />
0.70%<br />
0.60%<br />
0.50%<br />
0.40%<br />
EUR 10y10y smile<br />
JPY 10y10y smile<br />
0.30%<br />
0% 1% 2% 3% 4% 5% 6% 7% 8% 9%<br />
Source: <strong>BNP</strong> Paribas<br />
7.0<br />
6.0<br />
5.0<br />
4.0<br />
3.0<br />
2.0<br />
1.0<br />
0.0<br />
-1.0<br />
-2.0<br />
-3.0<br />
Chart 3: Terminal Payoff of EUR 10y10y<br />
3.50%-2.75%-1.00% Receiver Ladder<br />
-4.0<br />
0.00 1.00 2.00 3.00 4.00 5.00<br />
Source: <strong>BNP</strong> Paribas<br />
positively with the expected total return over the<br />
coming year (next two years) estimated at around<br />
8% (22%). Exposure to the skew dynamics is<br />
reflected by SABR Rho around EUR 10,000.<br />
Terminal max pay-out ratio is 1:14.<br />
Matteo Regesta 16 July 2010<br />
<strong>Market</strong> Mover, Non-Objective Research Section<br />
30<br />
www.Global<strong>Market</strong>s.bnpparibas.com


