

Market Mover - BNP PARIBAS - Investment Services India
Market Mover - BNP PARIBAS - Investment Services India
Market Mover - BNP PARIBAS - Investment Services India

You also want an ePaper? Increase the reach of your titles
YUMPU automatically turns print PDFs into web optimized ePapers that Google loves.
EUR: Monitoring Dutch Pension Funds<br />
• Asset allocation and duration risk analysis<br />
suggest that pension funds remain very<br />
sensitive to swap curve and equity gyrations.<br />
According to official DNB data and given swap and<br />
equity markets’ evolution over the past four months,<br />
we estimate the industry-wide cover ratio for Dutch<br />
pension funds to be around 106%. This is a minor<br />
deterioration from the 109% reported in Q3 2009.<br />
However, the interesting issue is more related to<br />
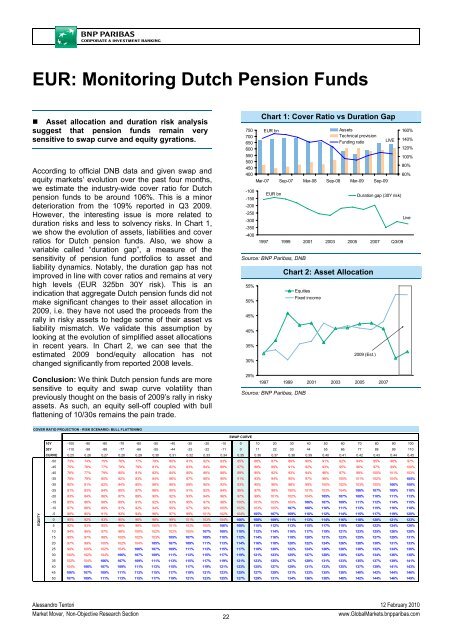
duration risks and less to solvency risks. In Chart 1,<br />
we show the evolution of assets, liabilities and cover<br />
ratios for Dutch pension funds. Also, we show a<br />
variable called “duration gap”, a measure of the<br />
sensitivity of pension fund portfolios to asset and<br />
liability dynamics. Notably, the duration gap has not<br />
improved in line with cover ratios and remains at very<br />
high levels (EUR 325bn 30Y risk). This is an<br />
indication that aggregate Dutch pension funds did not<br />
make significant changes to their asset allocation in<br />
2009, i.e. they have not used the proceeds from the<br />
rally in risky assets to hedge some of their asset vs<br />
liability mismatch. We validate this assumption by<br />
looking at the evolution of simplified asset allocations<br />
in recent years. In Chart 2, we can see that the<br />
estimated 2009 bond/equity allocation has not<br />
changed significantly from reported 2008 levels.<br />
Conclusion: We think Dutch pension funds are more<br />
sensitive to equity and swap curve volatility than<br />
previously thought on the basis of 2009’s rally in risky<br />
assets. As such, an equity sell-off coupled with bull<br />
flattening of 10/30s remains the pain trade.<br />
750<br />
700<br />
650<br />
600<br />
550<br />
500<br />
450<br />
400<br />
-100<br />
-150<br />
-200<br />
-250<br />
-300<br />
-350<br />
-400<br />
Chart 1: Cover Ratio vs Duration Gap<br />
EUR bn<br />
Mar-07 Sep-07 Mar-08 Sep-08 Mar-09 Sep-09<br />
EUR bn<br />
Assets<br />
Technical provision<br />
Funding ratio<br />
LIVE<br />
1997 1999 2001 2003 2005 2007 Q3/09<br />
Source: <strong>BNP</strong> Paribas, DNB<br />
55%<br />
50%<br />
45%<br />
40%<br />
35%<br />
30%<br />
25%<br />
Chart 2: Asset Allocation<br />
Equities<br />
Duration gap (30Y risk)<br />
1997 1999 2001 2003 2005 2007<br />
Source: <strong>BNP</strong> Paribas, DNB<br />
Fixed income<br />
2009 (Est.)<br />
160%<br />
140%<br />
120%<br />
100%<br />
80%<br />
60%<br />
Live<br />
COVER RATIO PROJECTION - RISK SCENARIO: BULL FLATTENING<br />
SWAP CURVE<br />
EQUITY<br />
10Y -100 -90 -80 -70 -60 -50 -40 -30 -20 -10 0 10 20 30 40 50 60 70 80 90 100<br />
30Y -110 -99 -88 -77 -66 -55 -44 -33 -22 -11 0 11 22 33 44 55 66 77 88 99 110<br />
CURVE 0.25 0.26 0.27 0.28 0.29 0.30 0.31 0.32 0.33 0.34 0.35 0.36 0.37 0.38 0.39 0.40 0.41 0.42 0.43 0.44 0.45<br />
-50 73% 74% 75% 76% 77% 79% 80% 81% 82% 83% 85% 86% 87% 89% 90% 91% 92% 94% 95% 96% 97%<br />
-45 75% 76% 77% 78% 79% 81% 82% 83% 84% 86% 87% 88% 89% 91% 92% 93% 95% 96% 97% 99% 100%<br />
-40 76% 77% 79% 80% 81% 82% 84% 85% 86% 88% 89% 90% 92% 93% 94% 96% 97% 99% 100% 101% 103%<br />
-35 78% 79% 80% 82% 83% 84% 86% 87% 88% 90% 91% 93% 94% 95% 97% 98% 100% 101% 102% 104% 105%<br />
-30 80% 81% 82% 84% 85% 86% 88% 89% 90% 92% 93% 95% 96% 98% 99% 100% 102% 103% 105% 106% 108%<br />
-25 81% 83% 84% 85% 87% 88% 90% 91% 92% 94% 95% 97% 98% 100% 101% 103% 104% 106% 107% 109% 110%<br />
-20 83% 84% 86% 87% 89% 90% 92% 93% 94% 96% 97% 99% 101% 102% 104% 105% 107% 108% 110% 111% 113%<br />
-15 85% 86% 88% 89% 91% 92% 93% 95% 97% 98% 100% 101% 103% 104% 106% 107% 109% 111% 112% 114% 115%<br />
-10 87% 88% 89% 91% 92% 94% 95% 97% 99% 100% 102% 103% 105% 107% 108% 110% 111% 113% 115% 116% 118%<br />
-5 88% 90% 91% 93% 94% 96% 97% 99% 101% 102% 104% 105% 107% 109% 110% 112% 114% 115% 117% 119% 120%<br />
0 90% 92% 93% 95% 96% 98% 99% 101% 103% 104% 106% 108% 109% 111% 113% 114% 116% 118% 120% 121% 123%<br />
5 92% 93% 95% 96% 98% 100% 101% 103% 105% 106% 108% 110% 112% 113% 115% 117% 119% 120% 122% 124% 126%<br />
10 94% 95% 97% 98% 100% 102% 103% 105% 107% 108% 110% 112% 114% 116% 117% 119% 121% 123% 125% 126% 128%<br />
15 95% 97% 98% 100% 102% 103% 105% 107% 109% 110% 112% 114% 116% 118% 120% 121% 123% 125% 127% 129% 131%<br />
20 97% 99% 100% 102% 104% 105% 107% 109% 111% 113% 114% 116% 118% 120% 122% 124% 126% 128% 130% 131% 133%<br />
25 99% 100% 102% 104% 106% 107% 109% 111% 113% 115% 117% 118% 120% 122% 124% 126% 128% 130% 132% 134% 136%<br />
30 100% 102% 104% 106% 107% 109% 111% 113% 115% 117% 119% 121% 123% 125% 127% 128% 130% 132% 134% 136% 138%<br />
35 102% 104% 106% 107% 109% 111% 113% 115% 117% 119% 121% 123% 125% 127% 129% 131% 133% 135% 137% 139% 141%<br />
40 104% 106% 107% 109% 111% 113% 115% 117% 119% 121% 123% 125% 127% 129% 131% 133% 135% 137% 139% 141% 143%<br />
45 106% 107% 109% 111% 113% 115% 117% 119% 121% 123% 125% 127% 129% 131% 133% 135% 138% 140% 142% 144% 146%<br />
50 107% 109% 111% 113% 115% 117% 119% 121% 123% 125% 127% 129% 131% 134% 136% 138% 140% 142% 144% 146% 149%<br />
Alessandro Tentori 12 February 2010<br />
<strong>Market</strong> <strong>Mover</strong>, Non-Objective Research Section<br />
22<br />
www.Global<strong>Market</strong>s.bnpparibas.com


