

Market Mover - BNP PARIBAS - Investment Services India
Market Mover - BNP PARIBAS - Investment Services India
Market Mover - BNP PARIBAS - Investment Services India

You also want an ePaper? Increase the reach of your titles
YUMPU automatically turns print PDFs into web optimized ePapers that Google loves.
Update on curves<br />
5/10y indices’ curves have experienced a massive<br />
flattening this week, in harmony with the widening of<br />
the outright levels. Taking the MAIN and FIN SEN<br />
and SUB as references – they are the only liquid<br />
curves – the extent of the flattening is of 4bp for<br />
MAIN and 6bp for both SEN and SUB financial<br />
indices. From the tightest of the market (65bp for<br />
MAIN 5y and 63bp for SEN 5y reached the 11-Jan),<br />
which also corresponds to the steepest level of 5/10y<br />
curves (20.5bp for MAIN and 17bp for SEN), the<br />
retracements are quite impressive. They are of 9bp<br />
in MAIN, 14bp in SEN and 13bp in SUB!<br />
While 5/10y curves were perfectly correlated to the<br />
outright level of the 5y before the last leg of volatility,<br />
there has been some de-correlation recently. With<br />
the market essentially focussed on the outright,<br />
curves are becoming more illiquid, which has the<br />
consequence of making their moves brutal and<br />
excessive.<br />
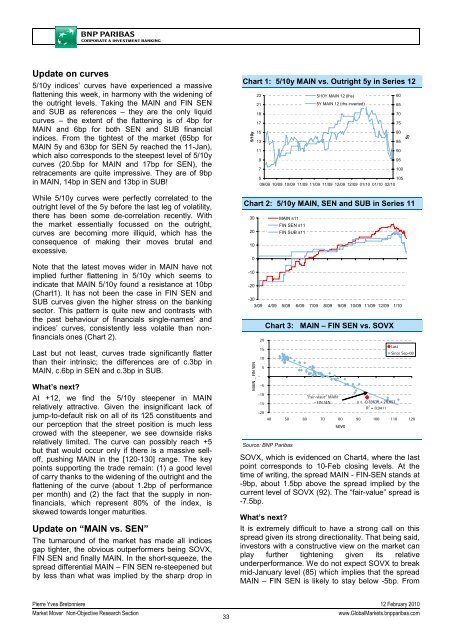
Note that the latest moves wider in MAIN have not<br />
implied further flattening in 5/10y which seems to<br />
indicate that MAIN 5/10y found a resistance at 10bp<br />
(Chart1). It has not been the case in FIN SEN and<br />
SUB curves given the higher stress on the banking<br />
sector. This pattern is quite new and contrasts with<br />
the past behaviour of financials single-names’ and<br />
indices’ curves, consistently less volatile than nonfinancials<br />
ones (Chart 2).<br />
Last but not least, curves trade significantly flatter<br />
than their intrinsic; the differences are of c.3bp in<br />
MAIN, c.6bp in SEN and c.3bp in SUB.<br />
What’s next?<br />
At +12, we find the 5/10y steepener in MAIN<br />
relatively attractive. Given the insignificant lack of<br />
jump-to-default risk on all of its 125 constituents and<br />
our perception that the street position is much less<br />
crowed with the steepener, we see downside risks<br />
relatively limited. The curve can possibly reach +5<br />
but that would occur only if there is a massive selloff,<br />
pushing MAIN in the [120-130] range. The key<br />
points supporting the trade remain: (1) a good level<br />
of carry thanks to the widening of the outright and the<br />
flattening of the curve (about 1.2bp of performance<br />
per month) and (2) the fact that the supply in nonfinancials,<br />
which represent 80% of the index, is<br />
skewed towards longer maturities.<br />
Update on “MAIN vs. SEN”<br />
The turnaround of the market has made all indices<br />
gap tighter, the obvious outperformers being SOVX,<br />
FIN SEN and finally MAIN. In the short-squeeze, the<br />
spread differential MAIN – FIN SEN re-steepened but<br />
by less than what was implied by the sharp drop in<br />
Chart 1: 5/10y MAIN vs. Outright 5y in Series 12<br />
5/10y<br />
23<br />
21<br />
19<br />
17<br />
15<br />
13<br />
11<br />
9<br />
7<br />
5/10Y MAIN 12 (lhs)<br />
5Y MAIN 12 (rhs inverted)<br />
60<br />
65<br />
70<br />
75<br />
80<br />
85<br />
90<br />
95<br />
100<br />
5<br />
105<br />
09/09 10/09 10/09 11/09 11/09 11/09 12/09 12/09 01/10 01/10 02/10<br />
Chart 2: 5/10y MAIN, SEN and SUB in Series 11<br />
30<br />
20<br />
10<br />
0<br />
-10<br />
-20<br />
-30<br />
3/09 4/09 5/09 6/09 7/09 8/09 9/09 10/09 11/09 12/09 1/10<br />
MAIN _ FIN SEN<br />
-<br />
20<br />
15<br />
10<br />
5<br />
-5<br />
-10<br />
-15<br />
-20<br />
MAIN s11<br />
FIN SEN s11<br />
FIN SUB s11<br />
Chart 3: MAIN – FIN SEN vs. SOVX<br />
y = -0.3963x + 28.857<br />
R 2 = 0.9411<br />
40 50 60 70 80 90 100 110 120<br />
Source: <strong>BNP</strong> Paribas<br />
"Fair-vlaue" MAIN<br />
- FIN SEN<br />
SOVX<br />
SOVX, which is evidenced on Chart4, where the last<br />
point corresponds to 10-Feb closing levels. At the<br />
time of writing, the spread MAIN - FIN-SEN stands at<br />
-9bp, about 1.5bp above the spread implied by the<br />
current level of SOVX (92). The “fair-value” spread is<br />
-7.5bp.<br />
What’s next?<br />
It is extremely difficult to have a strong call on this<br />
spread given its strong directionality. That being said,<br />
investors with a constructive view on the market can<br />
play further tightening given its relative<br />
underperformance. We do not expect SOVX to break<br />
mid-January level (85) which implies that the spread<br />
MAIN – FIN SEN is likely to stay below -5bp. From<br />
Last<br />
5y<br />
Since Sep-09<br />
Pierre Yves Bretonniere 12 February 2010<br />
<strong>Market</strong> <strong>Mover</strong> Non-Objective Research Section<br />
33<br />
www.Global<strong>Market</strong>s.bnpparibas.com


