

Market Mover - BNP PARIBAS - Investment Services India
Market Mover - BNP PARIBAS - Investment Services India
Market Mover - BNP PARIBAS - Investment Services India

Create successful ePaper yourself
Turn your PDF publications into a flip-book with our unique Google optimized e-Paper software.
Technical Analysis – Interest Rates & Commodities<br />
Bond & Short-Term Contracts<br />
• Europe: ST pullback on key 3.09/12 area may be over but a further rebound is needed to rekindle MT rising bias<br />
• US: ST pullback seen on key 3.50/55 area & market is now trying to resume MT rising bias towards 4% initially<br />
• Short-term contracts m0: Still a MT supportive bias but ST bias remains toppish/slightly consolidative<br />
Equities & Commodities<br />
• WTI (Cl1): Rebounded slightly above its MT rising channel support, but be beware of a renewed break below it<br />
• Equity markets: ST bias turned consolidative given break of MT rising pattern’s supports<br />
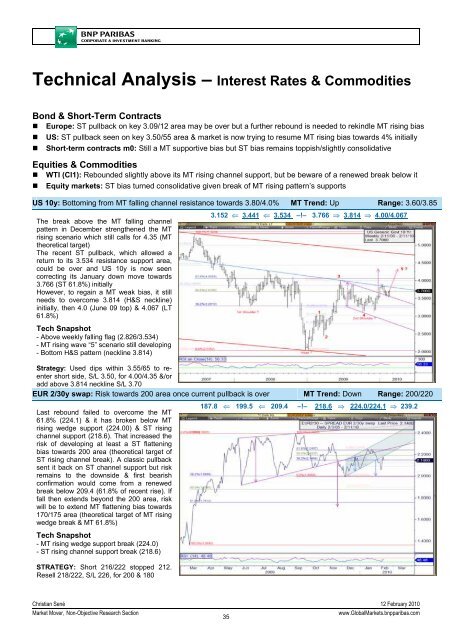
US 10y: Bottoming from MT falling channel resistance towards 3.80/4.0% MT Trend: Up Range: 3.60/3.85<br />
The break above the MT falling channel<br />
pattern in December strengthened the MT<br />
rising scenario which still calls for 4.35 (MT<br />
theoretical target)<br />
The recent ST pullback, which allowed a<br />
return to its 3.534 resistance support area,<br />
could be over and US 10y is now seen<br />
correcting its January down move towards<br />
3.766 (ST 61.8%) initially<br />
However, to regain a MT weak bias, it still<br />
needs to overcome 3.814 (H&S neckline)<br />
initially, then 4.0 (June 09 top) & 4.067 (LT<br />
61.8%)<br />
3.152 ⇐ 3.441 ⇐ 3.534 –!– 3.766 ⇒ 3.814 ⇒ 4.00/4.067<br />
Tech Snapshot<br />
- Above weekly falling flag (2.826/3.534)<br />
- MT rising wave “5” scenario still developing<br />
- Bottom H&S pattern (neckline 3.814)<br />
Strategy: Used dips within 3.55/65 to reenter<br />
short side, S/L 3.50, for 4.00/4.35 &/or<br />
add above 3.814 neckline S/L 3.70<br />
EUR 2/30y swap: Risk towards 200 area once current pullback is over MT Trend: Down Range: 200/220<br />
Last rebound failed to overcome the MT<br />
61.8% (224.1) & it has broken below MT<br />
rising wedge support (224.00) & ST rising<br />
channel support (218.6). That increased the<br />
risk of developing at least a ST flattening<br />
bias towards 200 area (theoretical target of<br />
ST rising channel break). A classic pullback<br />
sent it back on ST channel support but risk<br />
remains to the downside & first bearish<br />
confirmation would come from a renewed<br />
break below 209.4 (61.8% of recent rise). If<br />
fall then extends beyond the 200 area, risk<br />
will be to extend MT flattening bias towards<br />
170/175 area (theoretical target of MT rising<br />
wedge break & MT 61.8%)<br />
187.8 ⇐ 199.5 ⇐ 209.4 –!– 218.6 ⇒ 224.0/224.1 ⇒ 239.2<br />
Tech Snapshot<br />
- MT rising wedge support break (224.0)<br />
- ST rising channel support break (218.6)<br />
STRATEGY: Short 216/222 stopped 212.<br />
Resell 218/222, S/L 226, for 200 & 180<br />
Christian Sené 12 February 2010<br />
<strong>Market</strong> <strong>Mover</strong>, Non-Objective Research Section<br />
35<br />
www.Global<strong>Market</strong>s.bnpparibas.com


