

Market Mover - BNP PARIBAS - Investment Services India
Market Mover - BNP PARIBAS - Investment Services India
Market Mover - BNP PARIBAS - Investment Services India

Create successful ePaper yourself
Turn your PDF publications into a flip-book with our unique Google optimized e-Paper software.
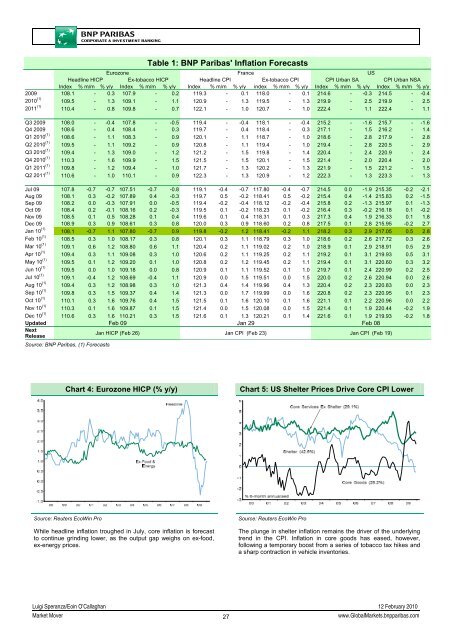
Table 1: <strong>BNP</strong> Paribas' Inflation Forecasts<br />
Eurozone<br />
France<br />
US<br />
Headline HICP Ex-tobacco HICP<br />
Headline CPI<br />
Ex-tobacco CPI<br />
CPI Urban SA CPI Urban NSA<br />
Index % m/m % y/y Index % m/m % y/y Index % m/m % y/y index % m/m % y/y Index % m/m % y/y Index % m/m % y/y<br />
2009 108.1 - 0.3 107.9 - 0.2 119.3 - 0.1 118.0 - 0.1 214.6 - -0.3 214.5 - -0.4<br />
2010 (1) 109.5 - 1.3 109.1 - 1.1 120.9 - 1.3 119.5 - 1.3 219.9 - 2.5 219.9 - 2.5<br />
2011 (1) 110.4 - 0.8 109.8 - 0.7 122.1 - 1.0 120.7 - 1.0 222.4 - 1.1 222.4 - 1.1<br />
Q3 2009 108.0 - -0.4 107.8 - -0.5 119.4 - -0.4 118.1 - -0.4 215.2 - -1.6 215.7 - -1.6<br />
Q4 2009 108.6 - 0.4 108.4 - 0.3 119.7 - 0.4 118.4 - 0.3 217.1 - 1.5 216.2 - 1.4<br />
Q1 2010 (1) 108.6 - 1.1 108.3 - 0.9 120.1 - 1.1 118.7 - 1.0 218.6 - 2.8 217.9 - 2.8<br />
Q2 2010 (1) 109.5 - 1.1 109.2 - 0.9 120.8 - 1.1 119.4 - 1.0 219.4 - 2.8 220.5 - 2.9<br />
Q3 2010 (1) 109.4 - 1.3 109.0 - 1.2 121.2 - 1.5 119.8 - 1.4 220.4 - 2.4 220.9 - 2.4<br />
Q4 2010 (1) 110.3 - 1.6 109.9 - 1.5 121.5 - 1.5 120.1 - 1.5 221.4 - 2.0 220.4 - 2.0<br />
Q1 2011 (1) 109.8 - 1.2 109.4 - 1.0 121.7 - 1.3 120.2 - 1.3 221.9 - 1.5 221.2 - 1.5<br />
Q2 2011 (1) 110.6 - 1.0 110.1 - 0.9 122.3 - 1.3 120.9 - 1.2 222.3 - 1.3 223.3 - 1.3<br />
Jul 09 107.8 -0.7 -0.7 107.51 -0.7 -0.8 119.1 -0.4 -0.7 117.80 -0.4 -0.7 214.5 0.0 -1.9 215.35 -0.2 -2.1<br />
Aug 09 108.1 0.3 -0.2 107.89 0.4 -0.3 119.7 0.5 -0.2 118.41 0.5 -0.2 215.4 0.4 -1.4 215.83 0.2 -1.5<br />
Sep 09 108.2 0.0 -0.3 107.91 0.0 -0.5 119.4 -0.2 -0.4 118.12 -0.2 -0.4 215.8 0.2 -1.3 215.97 0.1 -1.3<br />
Oct 09 108.4 0.2 -0.1 108.16 0.2 -0.3 119.5 0.1 -0.2 118.23 0.1 -0.2 216.4 0.3 -0.2 216.18 0.1 -0.2<br />
Nov 09 108.5 0.1 0.5 108.28 0.1 0.4 119.6 0.1 0.4 118.31 0.1 0.3 217.3 0.4 1.9 216.33 0.1 1.8<br />
Dec 09 108.9 0.3 0.9 108.61 0.3 0.8 120.0 0.3 0.9 118.60 0.2 0.8 217.5 0.1 2.8 215.95 -0.2 2.7<br />
Jan 10 (1) 108.1 -0.7 1.1 107.80 -0.7 0.9 119.8 -0.2 1.2 118.41 -0.2 1.1 218.2 0.3 2.9 217.05 0.5 2.8<br />
Feb 10 (1) 108.5 0.3 1.0 108.17 0.3 0.8 120.1 0.3 1.1 118.79 0.3 1.0 218.6 0.2 2.6 217.72 0.3 2.6<br />
Mar 10 (1) 109.1 0.6 1.2 108.80 0.6 1.1 120.4 0.2 1.1 119.02 0.2 1.0 218.9 0.1 2.9 218.91 0.5 2.9<br />
Apr 10 (1) 109.4 0.3 1.1 109.08 0.3 1.0 120.6 0.2 1.1 119.25 0.2 1.1 219.2 0.1 3.1 219.93 0.5 3.1<br />
May 10 (1) 109.5 0.1 1.2 109.20 0.1 1.0 120.8 0.2 1.2 119.45 0.2 1.1 219.4 0.1 3.1 220.60 0.3 3.2<br />
Jun 10 (1) 109.5 0.0 1.0 109.18 0.0 0.8 120.9 0.1 1.1 119.52 0.1 1.0 219.7 0.1 2.4 220.99 0.2 2.5<br />
Jul 10 (1) 109.1 -0.4 1.2 108.69 -0.4 1.1 120.9 0.0 1.5 119.51 0.0 1.5 220.0 0.2 2.6 220.94 0.0 2.6<br />
Aug 10 (1) 109.4 0.3 1.2 108.98 0.3 1.0 121.3 0.4 1.4 119.96 0.4 1.3 220.4 0.2 2.3 220.83 0.0 2.3<br />
Sep 10 (1) 109.8 0.3 1.5 109.37 0.4 1.4 121.3 0.0 1.7 119.99 0.0 1.6 220.8 0.2 2.3 220.95 0.1 2.3<br />
Oct 10 (1) 110.1 0.3 1.6 109.76 0.4 1.5 121.5 0.1 1.6 120.10 0.1 1.6 221.1 0.1 2.2 220.96 0.0 2.2<br />
Nov 10 (1) 110.3 0.1 1.6 109.87 0.1 1.5 121.4 0.0 1.5 120.08 0.0 1.5 221.4 0.1 1.9 220.44 -0.2 1.9<br />
Dec 10 (1) 110.6 0.3 1.6 110.21 0.3 1.5 121.6 0.1 1.3 120.21 0.1 1.4 221.6 0.1 1.9 219.93 -0.2 1.8<br />
Updated<br />
Next<br />
Release<br />
Feb 09<br />
Jan HICP (Feb 26)<br />
Jan 29<br />
Jan CPI (Feb 23)<br />
Feb 08<br />
Jan CPI (Feb 19)<br />
Source: <strong>BNP</strong> Paribas, (1) Forecasts<br />
Chart 4: Eurozone HICP (% y/y)<br />
Chart 5: US Shelter Prices Drive Core CPI Lower<br />
Source: Reuters EcoWin Pro<br />
While headline inflation troughed in July, core inflation is forecast<br />
to continue grinding lower, as the output gap weighs on ex-food,<br />
ex-energy prices.<br />
Source: Reuters EcoWin Pro<br />
The plunge in shelter inflation remains the driver of the underlying<br />
trend in the CPI. Inflation in core goods has eased, however,<br />
following a temporary boost from a series of tobacco tax hikes and<br />
a sharp contraction in vehicle inventories.<br />
Luigi Speranza/Eoin O’Callaghan 12 February 2010<br />
<strong>Market</strong> <strong>Mover</strong><br />
27<br />
www.Global<strong>Market</strong>s.bnpparibas.com


