Untitled - Oxfam Blogs
Untitled - Oxfam Blogs
Untitled - Oxfam Blogs

You also want an ePaper? Increase the reach of your titles
YUMPU automatically turns print PDFs into web optimized ePapers that Google loves.
Overview<br />
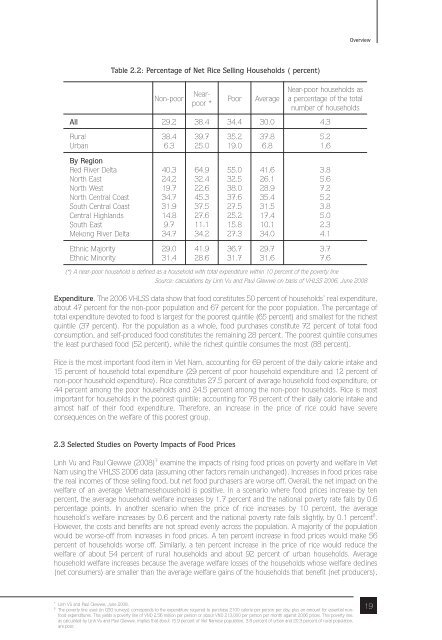
Table 2.2: Percentage of Net Rice Selling Households ( percent)<br />
Non-poor<br />
Nearpoor<br />
*<br />
Poor<br />
Average<br />
Near-poor households as<br />
a percentage of the total<br />
number of households<br />
All 29.2 38.4 34.4 30.0 4.3<br />
Rural<br />
Urban<br />
38.4<br />
6.3<br />
39.7<br />
25.0<br />
35.2<br />
19.0<br />
37.8<br />
6.8<br />
5.2<br />
1.6<br />
By Region<br />
Red River Delta<br />
North East<br />
North West<br />
North Central Coast<br />
South Central Coast<br />
Central Highlands<br />
South East<br />
Mekong River Delta<br />
40.3<br />
24.2<br />
19.7<br />
34.7<br />
31.9<br />
14.8<br />
9.7<br />
34.7<br />
64.9<br />
32.4<br />
22.6<br />
45.3<br />
37.5<br />
27.6<br />
11.1<br />
34.2<br />
55.0<br />
32.5<br />
38.0<br />
37.6<br />
27.5<br />
25.2<br />
15.8<br />
27.3<br />
41.6<br />
26.1<br />
28.9<br />
35.4<br />
31.5<br />
17.4<br />
10.1<br />
34.0<br />
3.8<br />
5.6<br />
7.2<br />
5.2<br />
3.8<br />
5.0<br />
2.3<br />
4.1<br />
Ethnic Majority<br />
Ethnic Minority<br />
29.0<br />
31.4<br />
41.9<br />
28.6<br />
36.7<br />
31.7<br />
29.7<br />
31.6<br />
3.7<br />
7.6<br />
(*) A near-poor household is defined as a household with total expenditure within 10 percent of the poverty line<br />
Source: calculations by Linh Vu and Paul Glewwe on basis of VHLSS 2006, June 2008<br />
Expenditure. The 2006 VHLSS data show that food constitutes 50 percent of households’ real expenditure,<br />
about 47 percent for the non-poor population and 67 percent for the poor population. The percentage of<br />
total expenditure devoted to food is largest for the poorest quintile (65 percent) and smallest for the richest<br />
quintile (37 percent). For the population as a whole, food purchases constitute 72 percent of total food<br />
consumption, and self-produced food constitutes the remaining 28 percent. The poorest quintile consumes<br />
the least purchased food (52 percent), while the richest quintile consumes the most (88 percent).<br />
Rice is the most important food item in Viet Nam, accounting for 69 percent of the daily calorie intake and<br />
15 percent of household total expenditure (29 percent of poor household expenditure and 12 percent of<br />
non-poor household expenditure). Rice constitutes 27.5 percent of average household food expenditure, or<br />
44 percent among the poor households and 24.5 percent among the non-poor households. Rice is most<br />
important for households in the poorest quintile; accounting for 78 percent of their daily calorie intake and<br />
almost half of their food expenditure. Therefore, an increase in the price of rice could have severe<br />
consequences on the welfare of this poorest group.<br />
2.3 Selected Studies on Poverty Impacts of Food Prices<br />
Linh Vu and Paul Glewwe (2008) 7 examine the impacts of rising food prices on poverty and welfare in Viet<br />
Nam using the VHLSS 2006 data (assuming other factors remain unchanged). Increases in food prices raise<br />
the real incomes of those selling food, but net food purchasers are worse off. Overall, the net impact on the<br />
welfare of an average Vietnamesehousehold is positive. In a scenario where food prices increase by ten<br />
percent, the average household welfare increases by 1.7 percent and the national poverty rate falls by 0.6<br />
percentage points. In another scenario when the price of rice increases by 10 percent, the average<br />
household’s welfare increases by 0.6 percent and the national poverty rate falls slightly, by 0.1 percent 8 .<br />
However, the costs and benefits are not spread evenly across the population. A majority of the population<br />
would be worse-off from increases in food prices. A ten percent increase in food prices would make 56<br />
percent of households worse off. Similarly, a ten percent increase in the price of rice would reduce the<br />
welfare of about 54 percent of rural households and about 92 percent of urban households. Average<br />
household welfare increases because the average welfare losses of the households whose welfare declines<br />
(net consumers) are smaller than the average welfare gains of the households that benefit (net producers),<br />
7 Linh V and Paul Glewwe, June 2008.<br />
8 The poverty line used (in GSO surveys) corresponds to the expenditure required to purchase 2100 calorie per person per day, plus an amount for essential nonfood<br />
expenditures. This yields a poverty line of VND 2.56 million per person or about VND 213,000 per person per month against 2006 prices. This poverty line,<br />
as calculated by Linh Vu and Paul Glewwe. implies that about 15.9 percent of Viet Namese population, 3.8 percent of urban and 20.3 percent of rural population,<br />
are poor.<br />
19