Untitled - Oxfam Blogs
Untitled - Oxfam Blogs
Untitled - Oxfam Blogs

Create successful ePaper yourself
Turn your PDF publications into a flip-book with our unique Google optimized e-Paper software.
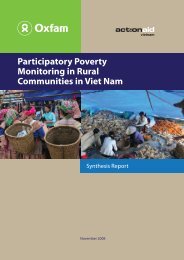
Impacts of Price Hikes on the<br />
Lives and Livelihoods<br />
of Poor People in Viet Nam<br />
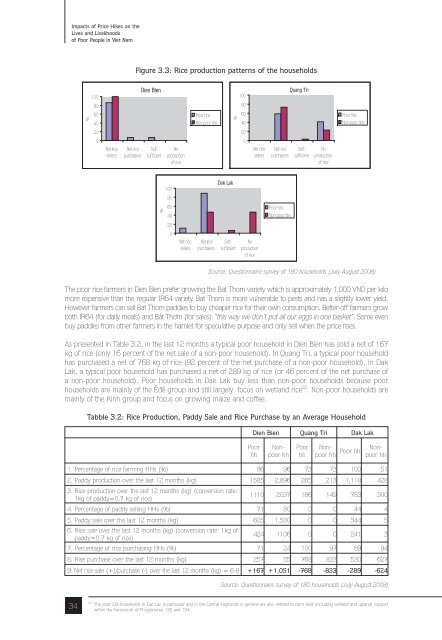
Figure 3.3: Rice production patterns of the households<br />
Source: Questionnaire survey of 180 households (July-August 2008)<br />
The poor rice farmers in Dien Bien prefer growing the Bat Thom variety which is approximately 1,000 VND per kilo<br />
more expensive than the regular IR64 variety. Bat Thom is more vulnerable to pests and has a slightly lower yield.<br />
However farmers can sell Bat Thom paddies to buy cheaper rice for their own consumption. Better-off farmers grow<br />
both IR64 (for daily meals) and Bát Thm (for sales):“this way we don’t put all our eggs in one basket“. Some even<br />
buy paddies from other farmers in the hamlet for speculative purpose and only sell when the price rises.<br />
As presented in Table 3.2, in the last 12 months a typical poor household in Dien Bien has sold a net of 167<br />
kg of rice (only 16 percent of the net sale of a non-poor household). In Quang Tri, a typical poor household<br />
has purchased a net of 768 kg of rice (92 percent of the net purchase of a non-poor household). In Dak<br />
Lak, a typical poor household has purchased a net of 289 kg of rice (or 46 percent of the net purchase of<br />
a non-poor household). Poor households in Dak Lak buy less than non-poor households because poor<br />
households are mainly of the Êđê group and still largely focus on wetland rice 22 . Non-poor households are<br />
mainly of the Kinh group and focus on growing maize and coffee.<br />
Tabble 3.2: Rice Production, Paddy Sale and Rice Purchase by an Average Household<br />
Dien Bien Quang Tri Dak Lak<br />
Poor<br />
hh<br />
Nonpoor<br />
hh<br />
Poor<br />
hh<br />
Nonpoor<br />
hh<br />
Poor hh<br />
Nonpoor<br />
hh<br />
1. Percentage of rice farming HHs (%) 86 96 73 73 100 51<br />
2. Paddy production over the last 12 months (kg) 1585 2,896 265 213 1,118 428<br />
3. Rice production over the last 12 months (kg) (conversion rate:<br />
1kg of paddy=0.7 kg of rice)<br />
1110 2037 186 149 783 300<br />
4. Percentage of paddy selling HHs (%) 71 80 0 0 44 4<br />
5. Paddy sale over the last 12 months (kg) 605 1,580 0 0 344 5<br />
6. Rice sale over the last 12 months (kg) (conversion rate: 1kg of<br />
paddy=0.7 kg of rice)<br />
424 1106 0 0 241 3<br />
7. Percentage of rice purchasing HHs (%) 71 24 100 97 89 94<br />
8. Rise purchase over the last 12 months (kg) 257 55 768 833 530 627<br />
9. Net rice sale (+)/purchase (-) over the last 12 months (kg) = 6-8 +167 +1,051 -768 -833 -289 -624<br />
Source: Questionnaire survey of 180 households (July-August 2008)<br />
34<br />
22 The poor EM households in Dac Lac in particular and in the Central Highlands in general are also entitled to farm land (including wetland and upland) support<br />
within the framework of Programmes 132 and 134.