Dual Enrollment of High School Students at Postsecondary Institutions
Dual Enrollment of High School Students at Postsecondary Institutions
Dual Enrollment of High School Students at Postsecondary Institutions

You also want an ePaper? Increase the reach of your titles
YUMPU automatically turns print PDFs into web optimized ePapers that Google loves.
<strong>Dual</strong> <strong>Enrollment</strong> <strong>of</strong><br />
<strong>High</strong> <strong>School</strong> <strong>Students</strong><br />
<strong>at</strong> <strong>Postsecondary</strong><br />
<strong>Institutions</strong>: 2002–03<br />
U.S. Department <strong>of</strong> Educ<strong>at</strong>ion<br />
Institute <strong>of</strong> Educ<strong>at</strong>ion Sciences<br />
NCES 2005-008<br />
E.D. TAB
<strong>Dual</strong> <strong>Enrollment</strong> <strong>of</strong><br />
<strong>High</strong> <strong>School</strong> <strong>Students</strong><br />
<strong>at</strong> <strong>Postsecondary</strong><br />
<strong>Institutions</strong>: 2002–03<br />
U.S. Department <strong>of</strong> Educ<strong>at</strong>ion<br />
Institute <strong>of</strong> Educ<strong>at</strong>ion Sciences<br />
NCES 2005–008<br />
E.D. TAB<br />
April 2005<br />
Brian Kleiner<br />
Laurie Lewis<br />
West<strong>at</strong><br />
Bernard Greene<br />
Project Officer<br />
N<strong>at</strong>ional Center for<br />
Educ<strong>at</strong>ion St<strong>at</strong>istics
U.S. Department <strong>of</strong> Educ<strong>at</strong>ion<br />
Margaret Spellings<br />
Secretary<br />
Institute <strong>of</strong> Educ<strong>at</strong>ion Sciences<br />
Grover J. Whitehurst<br />
Director<br />
N<strong>at</strong>ional Center for Educ<strong>at</strong>ion St<strong>at</strong>istics<br />
Grover J. Whitehurst<br />
Acting Commissioner<br />
The N<strong>at</strong>ional Center for Educ<strong>at</strong>ion St<strong>at</strong>istics (NCES) is the primary federal entity for collecting, analyzing,<br />
and reporting d<strong>at</strong>a rel<strong>at</strong>ed to educ<strong>at</strong>ion in the United St<strong>at</strong>es and other n<strong>at</strong>ions. It fulfills a congressional<br />
mand<strong>at</strong>e to collect, coll<strong>at</strong>e, analyze, and report full and complete st<strong>at</strong>istics on the condition <strong>of</strong> educ<strong>at</strong>ion in<br />
the United St<strong>at</strong>es; conduct and publish reports and specialized analyses <strong>of</strong> the meaning and significance<br />
<strong>of</strong> such st<strong>at</strong>istics; assist st<strong>at</strong>e and local educ<strong>at</strong>ion agencies in improving their st<strong>at</strong>istical systems; and<br />
review and report on educ<strong>at</strong>ion activities in foreign countries.<br />
NCES activities are designed to address high priority educ<strong>at</strong>ion d<strong>at</strong>a needs; provide consistent, reliable,<br />
complete, and accur<strong>at</strong>e indic<strong>at</strong>ors <strong>of</strong> educ<strong>at</strong>ion st<strong>at</strong>us and trends; and report timely, useful, and high<br />
quality d<strong>at</strong>a to the U.S. Department <strong>of</strong> Educ<strong>at</strong>ion, the Congress, the st<strong>at</strong>es, other educ<strong>at</strong>ion policymakers,<br />
practitioners, d<strong>at</strong>a users, and the general public.<br />
We strive to make our products available in a variety <strong>of</strong> form<strong>at</strong>s and in language th<strong>at</strong> is appropri<strong>at</strong>e to a<br />
variety <strong>of</strong> audiences. You, as our customer, are the best judge <strong>of</strong> our success in communic<strong>at</strong>ing<br />
inform<strong>at</strong>ion effectively. If you have any comments or suggestions about this or any other NCES product<br />
or report, we would like to hear from you. Please direct your comments to:<br />
April 2005<br />
N<strong>at</strong>ional Center for Educ<strong>at</strong>ion St<strong>at</strong>istics<br />
Institute <strong>of</strong> Educ<strong>at</strong>ion Sciences<br />
U.S. Department <strong>of</strong> Educ<strong>at</strong>ion<br />
1990 K Street NW<br />
Washington, DC 20006<br />
The NCES World Wide Web Home Page is: http://nces.ed.gov<br />
The NCES World Wide Web Electronic C<strong>at</strong>alog is: http://nces.ed.gov/pubsearch<br />
Suggested Cit<strong>at</strong>ion<br />
Kleiner, B., and Lewis, L. (2005). <strong>Dual</strong> <strong>Enrollment</strong> <strong>of</strong> <strong>High</strong> <strong>School</strong> <strong>Students</strong> <strong>at</strong> <strong>Postsecondary</strong> <strong>Institutions</strong>:<br />
2002–03 (NCES 2005–008). U.S. Department <strong>of</strong> Educ<strong>at</strong>ion. Washington, DC: N<strong>at</strong>ional Center for<br />
Educ<strong>at</strong>ion St<strong>at</strong>istics.<br />
For ordering inform<strong>at</strong>ion on this report, write:<br />
U.S. Department <strong>of</strong> Educ<strong>at</strong>ion<br />
ED Pubs<br />
P.O. Box 1398<br />
Jessup, MD 20794–1398<br />
Call toll free 1–877–4ED–Pubs; or order online <strong>at</strong> www.edpubs.org<br />
Content Contact:<br />
Bernard Greene<br />
(202) 502-7348<br />
e-mail: Bernard.Greene@ed.gov
Acknowledgments<br />
The authors wish to thank the many individuals who contributed to the development <strong>of</strong> the<br />
“<strong>Dual</strong> <strong>Enrollment</strong> Programs and Courses for <strong>High</strong> <strong>School</strong> <strong>Students</strong>” survey and this report. The survey<br />
was requested by the Office <strong>of</strong> Voc<strong>at</strong>ional and Adult Educ<strong>at</strong>ion <strong>of</strong> the U.S. Department <strong>of</strong> Educ<strong>at</strong>ion.<br />
Bernie Greene was the NCES Project Officer.<br />
West<strong>at</strong>’s project director was Laurie Lewis, and the survey manager was Brian Kleiner.<br />
Debbie Alexander directed the d<strong>at</strong>a collection efforts, assisted by R<strong>at</strong>na Basavaraju and Anjali Pandit.<br />
Nazik Elgaddal, Alla Belenky, and Robert DelFierro were the programmers, Carol Litman was the editor,<br />
and Sylvie Warren was responsible for form<strong>at</strong>ting the report.<br />
The NCES staff who reviewed the report and provided valuable suggestions include Val<br />
Plisko, Shelley Burns, Jeff Owings, James Griffith, Carol Chelemer, and Robert Lerner. Reviewers<br />
outside <strong>of</strong> NCES included Susan Henderson from the University <strong>of</strong> Minnesota, and Tom Nachazel, Pia<br />
Peltola, Zeyu Xu, Kevin Bromer, and Geeta Kotak <strong>of</strong> the Educ<strong>at</strong>ion St<strong>at</strong>istics Services Institute,<br />
American Institutes for Research. The report was also reviewed by Duc-Le To <strong>of</strong> the Institute <strong>of</strong><br />
Educ<strong>at</strong>ion Sciences.<br />
iii
This page intentionally left blank.<br />
iv
Table <strong>of</strong> Contents<br />
Page<br />
Acknowledgments .......................................................................................................................<br />
List <strong>of</strong> Tables ..............................................................................................................................<br />
List <strong>of</strong> Figures .............................................................................................................................<br />
iii<br />
vi<br />
x<br />
Summary ..................................................................................................................................... 1<br />
Background .......................................................................................................................... 1<br />
Selected Findings ................................................................................................................. 4<br />
Prevalence <strong>of</strong> and <strong>Enrollment</strong> in <strong>Dual</strong> <strong>Enrollment</strong> Programs and College-<br />
Level Courses ................................................................................................... 4<br />
Prevalence <strong>of</strong> <strong>Dual</strong> <strong>Enrollment</strong> Programs and College Coursetaking ............. 4<br />
<strong>Enrollment</strong> <strong>of</strong> <strong>High</strong> <strong>School</strong> <strong>Students</strong> in <strong>Dual</strong> <strong>Enrollment</strong> Programs<br />
and College-Level Courses ........................................................................ 7<br />
Characteristics <strong>of</strong> <strong>Dual</strong> <strong>Enrollment</strong> Programs ......................................................... 9<br />
Course Loc<strong>at</strong>ion and Type <strong>of</strong> Instructors ......................................................... 9<br />
Curriculum and Coursetaking P<strong>at</strong>terns ............................................................ 10<br />
Credit Award .................................................................................................... 11<br />
Academic Eligibility Requirements ................................................................. 11<br />
Funding ............................................................................................................ 13<br />
<strong>Dual</strong> <strong>Enrollment</strong> Programs Specifically for <strong>Students</strong> <strong>at</strong> Risk <strong>of</strong> Educ<strong>at</strong>ion<br />
Failure ............................................................................................................... 14<br />
References ................................................................................................................................... 19<br />
Tables <strong>of</strong> Estim<strong>at</strong>es and Standard Errors ................................................................................ 21<br />
Appendix A: Technical Notes ................................................................................................... A-1<br />
Appendix B: Questionnaire ...................................................................................................... B-1<br />
v
List <strong>of</strong> Tables<br />
Table<br />
Page<br />
1 Percent <strong>of</strong> Title IV degree-granting institutions with any high school students<br />
taking courses for college credit, within and outside <strong>of</strong> dual enrollment<br />
programs, by institution type and size: 12-month academic year, 2002–03 ................... 22<br />
1-A Standard errors <strong>of</strong> the percent <strong>of</strong> Title IV degree-granting institutions with any<br />
high school students taking courses for college credit, within and outside <strong>of</strong> dual<br />
enrollment programs, by institution type and size: 12-month academic year,<br />
2002–03 ........................................................................................................................... 23<br />
2 Number <strong>of</strong> high school students who took college-level courses through Title<br />
IV degree-granting institutions, within and outside <strong>of</strong> dual enrollment programs,<br />
by institution type and size: 12-month academic year, 2002–03 .................................... 24<br />
2-A Standard errors <strong>of</strong> the number <strong>of</strong> high school students who took college-level<br />
courses through Title IV degree-granting institutions, within and outside <strong>of</strong> dual<br />
enrollment programs, by institution type and size: 12-month academic year,<br />
2002–03 ........................................................................................................................... 25<br />
3 Percent <strong>of</strong> Title IV degree-granting institutions with dual enrollment programs<br />
indic<strong>at</strong>ing the loc<strong>at</strong>ion <strong>of</strong> courses taken by high school students in the dual<br />
enrollment programs, by institution type and size: 12-month academic year,<br />
2002–03 ........................................................................................................................... 26<br />
3-A Standard errors <strong>of</strong> the percent <strong>of</strong> Title IV degree-granting institutions with dual<br />
enrollment programs indic<strong>at</strong>ing the loc<strong>at</strong>ion <strong>of</strong> courses taken by high school<br />
students in the dual enrollment programs, by institution type and size:<br />
12-month academic year, 2002–03 ................................................................................. 27<br />
4 Number <strong>of</strong> Title IV degree-granting institutions reporting <strong>at</strong> least some courses<br />
taught on a high school campus, and the percentage distribution <strong>of</strong> institutions<br />
indic<strong>at</strong>ing the type <strong>of</strong> course instructors who taught these courses, by institution<br />
type and size: 12-month academic year, 2002–03 .......................................................... 28<br />
4-A Standard errors <strong>of</strong> the number <strong>of</strong> Title IV degree-granting institutions reporting<br />
<strong>at</strong> least some courses taught on a high school campus, and the percentage<br />
distribution <strong>of</strong> institutions indic<strong>at</strong>ing the type <strong>of</strong> course instructors who taught<br />
these courses, by institution type and size: 12-month academic year, 2002–03 ............. 29<br />
5 Number <strong>of</strong> Title IV degree-granting institutions reporting <strong>at</strong> least some courses<br />
taught by high school instructors, and the percentage distribution <strong>of</strong> institutions<br />
indic<strong>at</strong>ing the minimum qualific<strong>at</strong>ions for high school instructors who taught<br />
these courses, by institution type and size: 12-month academic year, 2002–03 ............. 30<br />
vi
List <strong>of</strong> Tables (continued)<br />
Table<br />
Page<br />
5-A Standard errors <strong>of</strong> the number <strong>of</strong> Title IV degree-granting institutions reporting<br />
<strong>at</strong> least some courses taught by high school instructors, and the percentage<br />
distribution <strong>of</strong> institutions indic<strong>at</strong>ing the minimum qualific<strong>at</strong>ions for high<br />
school instructors who taught these courses, by institution type and size:<br />
12-month academic year, 2002–03 ................................................................................. 31<br />
6 Percentage distribution <strong>of</strong> Title IV degree-granting institutions with dual<br />
enrollment programs indic<strong>at</strong>ing the typical p<strong>at</strong>tern <strong>of</strong> high school enrollments<br />
per academic term, by institution type and size: 12-month academic year,<br />
2002–03 ........................................................................................................................... 32<br />
6-A Standard errors <strong>of</strong> the percentage distribution <strong>of</strong> Title IV degree-granting<br />
institutions with dual enrollment programs indic<strong>at</strong>ing the typical p<strong>at</strong>tern <strong>of</strong> high<br />
school enrollments per academic term, by institution type and size: 12-month<br />
academic year, 2002–03 .................................................................................................. 33<br />
7 Percentage distribution <strong>of</strong> Title IV degree-granting institutions with dual<br />
enrollment programs indic<strong>at</strong>ing the maximum number <strong>of</strong> allowable courses per<br />
academic term, by institution type and size: 12-month academic year, 2002–03............ 34<br />
7-A Standard errors <strong>of</strong> the percentage distribution <strong>of</strong> Title IV degree-granting<br />
institutions with dual enrollment programs indic<strong>at</strong>ing the maximum number <strong>of</strong><br />
allowable courses per academic term, by institution type and size: 12-month<br />
academic year, 2002–03 .................................................................................................. 35<br />
8 Percentage distribution <strong>of</strong> Title IV degree-granting institutions with dual<br />
enrollment programs indic<strong>at</strong>ing whether the curriculum <strong>of</strong> programs was<br />
specially designed for high school students or the same as for regular college<br />
students, by institution type and size: 12-month academic year, 2002–03 ..................... 36<br />
8-A Standard errors <strong>of</strong> the percentage distribution <strong>of</strong> Title IV degree-granting<br />
institutions with dual enrollment programs indic<strong>at</strong>ing whether the curriculum <strong>of</strong><br />
programs was specially designed for high school students or the same as for<br />
regular college students, by institution type and size: 12-month academic year,<br />
2002–03 ........................................................................................................................... 37<br />
9 Percentage distribution <strong>of</strong> Title IV degree-granting institutions with dual<br />
enrollment programs indic<strong>at</strong>ing when high school students were generally<br />
awarded college credit for courses taken, by institution type and size:<br />
12-month academic year, 2002–03 ................................................................................. 38<br />
9-A Standard errors <strong>of</strong> the percentage distribution <strong>of</strong> Title IV degree-granting<br />
institutions with dual enrollment programs indic<strong>at</strong>ing when high school students<br />
were generally awarded college credit for courses taken, by institution type and<br />
size: 12-month academic year, 2002–03 ......................................................................... 39<br />
vii
List <strong>of</strong> Tables (continued)<br />
Table<br />
Page<br />
10 Percentage distribution <strong>of</strong> Title IV degree-granting institutions with dual<br />
enrollment programs indic<strong>at</strong>ing the level <strong>at</strong> which credit was earned,<br />
by institution type and size: 12-month academic year, 2002–03 .................................... 40<br />
10-A Standard errors <strong>of</strong> the percentage distribution <strong>of</strong> Title IV degree-granting<br />
institutions with dual enrollment programs indic<strong>at</strong>ing the level <strong>at</strong> which credit<br />
was earned, by institution type and size: 12-month academic year, 2002–03 ................. 41<br />
11 Percent <strong>of</strong> Title IV degree-granting institutions with dual enrollment programs<br />
th<strong>at</strong> had academic eligibility requirements for high school students to particip<strong>at</strong>e<br />
in the dual enrollment program and wh<strong>at</strong> those academic eligibility<br />
requirements were, by institution type and size: 12-month academic year,<br />
2002–03 ........................................................................................................................... 42<br />
11-A Standard errors <strong>of</strong> the percent <strong>of</strong> Title IV degree-granting institutions with dual<br />
enrollment programs th<strong>at</strong> had academic eligibility requirements for high school<br />
students to particip<strong>at</strong>e in the dual enrollment program and wh<strong>at</strong> those academic<br />
eligibility requirements were, by institution type and size: 12-month academic<br />
year, 2002–03 .................................................................................................................. 43<br />
12 Percent <strong>of</strong> Title IV degree-granting institutions with dual enrollment programs<br />
th<strong>at</strong> had a minimum high school grade point average requirement to particip<strong>at</strong>e<br />
in the dual enrollment program, and the percentage distribution <strong>of</strong> the minimum<br />
GPA requirement, by institution type and size: 12-month academic year,<br />
2002–03 ........................................................................................................................... 44<br />
12-A Standard errors <strong>of</strong> the percent <strong>of</strong> Title IV degree-granting institutions with dual<br />
enrollment programs th<strong>at</strong> had a minimum high school grade point average<br />
requirement to particip<strong>at</strong>e in the dual enrollment program, and the percentage<br />
distribution <strong>of</strong> the minimum GPA requirement, by institution type and size: 12-<br />
month academic year, 2002–03 ....................................................................................... 45<br />
13 Percent <strong>of</strong> Title IV degree-granting institutions with dual enrollment programs<br />
th<strong>at</strong> had academic eligibility requirements for high school students to particip<strong>at</strong>e<br />
in the dual enrollment programs, and the percentage distribution <strong>of</strong> institutions<br />
indic<strong>at</strong>ing whether those requirements were the same or different than the<br />
institution’s admissions standards for regular college students, by institution<br />
type and size: 12-month academic year, 2002–03 .......................................................... 46<br />
13-A Standard errors <strong>of</strong> the percent <strong>of</strong> Title IV degree-granting institutions with dual<br />
enrollment programs th<strong>at</strong> had academic eligibility requirements for high school<br />
students to particip<strong>at</strong>e in the dual enrollment programs, and the percentage<br />
distribution <strong>of</strong> institutions indic<strong>at</strong>ing whether those requirements were the same<br />
or different than the institution’s admissions standards for regular college<br />
students, by institution type and size: 12-month academic year, 2002–03 ..................... 47<br />
viii
List <strong>of</strong> Tables (continued)<br />
Table<br />
Page<br />
14 Percent <strong>of</strong> Title IV degree-granting institutions with dual enrollment programs<br />
indic<strong>at</strong>ing the grade levels <strong>of</strong> students eligible for the dual enrollment programs,<br />
by institution type and size: 12-month academic year, 2002–03 .................................... 48<br />
14-A Standard errors <strong>of</strong> the percent <strong>of</strong> Title IV degree-granting institutions with dual<br />
enrollment programs indic<strong>at</strong>ing the grade levels <strong>of</strong> students for the dual<br />
enrollment programs, by institution type and size: 12-month academic year,<br />
2002–03 ........................................................................................................................... 49<br />
15 Percent <strong>of</strong> Title IV degree-granting institutions with dual enrollment programs<br />
indic<strong>at</strong>ing which sources paid tuition for college-level courses taken in the dual<br />
enrollment programs, by institution type and size: 12-month academic year,<br />
2002–03 ........................................................................................................................... 50<br />
15-A Standard errors <strong>of</strong> the percent <strong>of</strong> Title IV degree-granting institutions with dual<br />
enrollment programs indic<strong>at</strong>ing which sources paid tuition for college-level<br />
courses taken in the dual enrollment programs, by institution type and size: 12-<br />
month academic year, 2002–03 ....................................................................................... 51<br />
16 Percentage distribution <strong>of</strong> Title IV degree-granting institutions with dual<br />
enrollment programs indic<strong>at</strong>ing the type <strong>of</strong> payment generally made by parents<br />
and students for courses taken in the dual enrollment programs, by institution<br />
type and size: 12-month academic year, 2002–03 .......................................................... 52<br />
16-A Standard errors <strong>of</strong> the percentage distribution <strong>of</strong> Title IV degree-granting<br />
institutions with dual enrollment programs indic<strong>at</strong>ing the type <strong>of</strong> payment<br />
generally made by parents and students for courses taken in the dual enrollment<br />
programs, by institution type and size: 12-month academic year, 2002–03 ................... 53<br />
17 Number and percent <strong>of</strong> Title IV degree-granting institutions with dual<br />
enrollment programs geared specifically toward high school students <strong>at</strong> risk <strong>of</strong><br />
educ<strong>at</strong>ion failure, by institution type and size: 12-month academic year,<br />
2002–03 ........................................................................................................................... 54<br />
17-A Standard errors <strong>of</strong> the number and percent <strong>of</strong> Title IV degree-granting<br />
institutions with dual enrollment programs geared specifically toward high<br />
school students <strong>at</strong> risk <strong>of</strong> educ<strong>at</strong>ional failure, by institution type and size:<br />
12-month academic year, 2002–03 ................................................................................. 55<br />
18 Standard errors for figures: 12-month academic year, 2002–03 ..................................... 56<br />
A-1 Number and percent <strong>of</strong> Title IV degree-granting institutions in the study, and<br />
the estim<strong>at</strong>ed number and percent in the n<strong>at</strong>ion, for the total sample and for<br />
institutions th<strong>at</strong> had any dual enrollment, by institution type and size: 2004 ................ A-5<br />
A-2 Number <strong>of</strong> cases with imputed d<strong>at</strong>a in the study sample, and number <strong>of</strong> cases<br />
with imputed d<strong>at</strong>a the sample represents, by questionnaire items: 2004 ........................ A-6<br />
ix
List <strong>of</strong> Figures<br />
Figure<br />
Page<br />
1 Percentage distribution <strong>of</strong> Title IV degree-granting institutions with any high<br />
school students taking courses for college credit, by whether courses were taken<br />
within dual enrollment programs only, outside <strong>of</strong> dual enrollment programs<br />
only, or both within and outside <strong>of</strong> programs: 12-month academic year,<br />
2002–03 ........................................................................................................................... 5<br />
2 Percentage distribution <strong>of</strong> high school students taking courses for college credit<br />
within or outside <strong>of</strong> dual enrollment programs: 12-month academic year,<br />
2002–03 ........................................................................................................................... 7<br />
3 Percentage distribution <strong>of</strong> high school students taking courses for college credit,<br />
by institution type: 12-month academic year, 2002–03 .................................................. 8<br />
4 Percentage distribution <strong>of</strong> Title IV degree-granting institutions with dual<br />
enrollment programs for <strong>at</strong>-risk high school students, by primary focus <strong>of</strong> such<br />
programs: 12-month academic year, 2002–03 ................................................................ 15<br />
5 Percentage distribution <strong>of</strong> Title IV degree-granting institutions with dual<br />
enrollment programs for <strong>at</strong>-risk high school students, by typical p<strong>at</strong>terns <strong>of</strong><br />
enrollments in such programs: 12-month academic year, 2002–03 ................................ 16<br />
6 Percent <strong>of</strong> Title IV degree-granting institutions with dual enrollment programs<br />
for <strong>at</strong>-risk high school students th<strong>at</strong> had extra support services, by specific extra<br />
support services: 12-month academic year, 2002–03 ..................................................... 17<br />
x
Summary<br />
Background<br />
This report provides d<strong>at</strong>a from a n<strong>at</strong>ionally represent<strong>at</strong>ive survey <strong>of</strong> Title IV degree-granting<br />
postsecondary institutions on the topic <strong>of</strong> dual enrollment <strong>of</strong> high school students. <strong>Dual</strong> enrollment, also<br />
known as “dual credit,” “concurrent enrollment,” and “joint enrollment,” refers to the particip<strong>at</strong>ion in<br />
college-level courses and the earning <strong>of</strong> college credits by high school students. <strong>Dual</strong> enrollment is<br />
viewed as providing high school students benefits such as gre<strong>at</strong>er access to a wider range <strong>of</strong> rigorous<br />
academic and technical courses, savings in time and money on a college degree, promoting efficiency <strong>of</strong><br />
learning, and enhancing admission to and retention in college. By providing a p<strong>at</strong>hway for students to<br />
move seamlessly between K–12 and postsecondary systems, dual enrollment is thought to promote<br />
gre<strong>at</strong>er support for students’ college aspir<strong>at</strong>ions and gre<strong>at</strong>er collabor<strong>at</strong>ion between high schools and<br />
colleges (Bailey and Karp 2003; Clark 2001). In an effort to prepare high school students for college, 38<br />
st<strong>at</strong>es have enacted dual enrollment policies th<strong>at</strong> support the development <strong>of</strong> programs th<strong>at</strong> promote a<br />
smoother transition between high school and postsecondary educ<strong>at</strong>ion (Karp et al. 2004). However, <strong>at</strong><br />
present, there is no existing n<strong>at</strong>ional source <strong>of</strong> inform<strong>at</strong>ion on dual enrollment <strong>of</strong> high school students <strong>at</strong><br />
postsecondary institutions. The “<strong>Dual</strong> <strong>Enrollment</strong> Programs and Courses for <strong>High</strong> <strong>School</strong> <strong>Students</strong>”<br />
survey, undertaken by the N<strong>at</strong>ional Center for Educ<strong>at</strong>ion St<strong>at</strong>istics (NCES), Institute <strong>of</strong> Educ<strong>at</strong>ion<br />
Sciences, was designed to provide policymakers, researchers, educ<strong>at</strong>ors, and administr<strong>at</strong>ors with baseline<br />
inform<strong>at</strong>ion on the prevalence and characteristics <strong>of</strong> dual enrollment programs. While the majority <strong>of</strong> the<br />
survey’s questions focused on dual enrollment programs, several key questions also revealed the<br />
prevalence <strong>of</strong> college coursetaking outside <strong>of</strong> dual enrollment programs by high school students. The<br />
survey was requested by the Office <strong>of</strong> Voc<strong>at</strong>ional and Adult Educ<strong>at</strong>ion, U.S. Department <strong>of</strong> Educ<strong>at</strong>ion.<br />
The front page <strong>of</strong> the survey included a definition and description <strong>of</strong> dual enrollment (see<br />
appendix B). For this study, dual enrollment was defined as high school students who earn college credits<br />
for courses taken through a postsecondary institution. The definition specified th<strong>at</strong> courses could be part<br />
<strong>of</strong> a dual enrollment program, or courses could be taken outside <strong>of</strong> a dual enrollment program. A dual<br />
enrollment program was defined as an organized system with special guidelines th<strong>at</strong> allows high school<br />
students to take college-level courses. The guidelines might deline<strong>at</strong>e entrance or eligibility requirements,<br />
funding, limits on coursetaking, and so on. <strong>High</strong> school students who simply enrolled in college courses<br />
and were tre<strong>at</strong>ed as regular college students were not considered to be particip<strong>at</strong>ing in a dual enrollment<br />
program. Credit for courses could be earned <strong>at</strong> both the high school and college level simultaneously or<br />
1
only <strong>at</strong> the college level, and credit could be earned immedi<strong>at</strong>ely or upon enrollment <strong>at</strong> the postsecondary<br />
institution after high school gradu<strong>at</strong>ion. Courses could be taught on a college campus, on a high school<br />
campus, or <strong>at</strong> some other loc<strong>at</strong>ion. The time frame for the survey was the 2002–03 12-month academic<br />
year, including courses taken during summer sessions. 1 The survey definition also specified th<strong>at</strong><br />
inform<strong>at</strong>ion about summer bridge programs for students who had already gradu<strong>at</strong>ed from high school<br />
should not be included.<br />
This survey was conducted by the N<strong>at</strong>ional Center for Educ<strong>at</strong>ion St<strong>at</strong>istics (NCES) using the<br />
<strong>Postsecondary</strong> Educ<strong>at</strong>ion Quick Inform<strong>at</strong>ion System (PEQIS). 2 PEQIS is a survey system designed to<br />
collect small amounts <strong>of</strong> issue-oriented d<strong>at</strong>a from a previously recruited, n<strong>at</strong>ionally represent<strong>at</strong>ive sample<br />
<strong>of</strong> institutions, with minimal burden on respondents and within a rel<strong>at</strong>ively short period <strong>of</strong> time.<br />
Questionnaires for the survey “<strong>Dual</strong> <strong>Enrollment</strong> Programs and Courses for <strong>High</strong> <strong>School</strong> <strong>Students</strong>” were<br />
mailed in February 2004 to the PEQIS survey coordin<strong>at</strong>ors <strong>at</strong> the approxim<strong>at</strong>ely 1,600 Title IV degreegranting<br />
postsecondary institutions in the 50 st<strong>at</strong>es and the District <strong>of</strong> Columbia th<strong>at</strong> compose the PEQIS<br />
panel. Coordin<strong>at</strong>ors were informed th<strong>at</strong> the survey was designed to be completed by the person(s) <strong>at</strong> the<br />
institution most knowledgeable about the institution’s dual enrollment programs and courses.<br />
Respondents were given the option <strong>of</strong> completing the survey online. D<strong>at</strong>a were adjusted for questionnaire<br />
nonresponse and weighted to yield n<strong>at</strong>ional estim<strong>at</strong>es th<strong>at</strong> represent all Title IV-eligible, degree-granting<br />
institutions in the United St<strong>at</strong>es. 3 The unweighted response r<strong>at</strong>e was 92 percent, and the weighted<br />
response r<strong>at</strong>e 4 was 93 percent. Detailed inform<strong>at</strong>ion about the survey methodology is provided in<br />
appendix A, and the questionnaire can be found in appendix B.<br />
Survey respondents <strong>at</strong> selected postsecondary institutions were asked to report on the<br />
prevalence <strong>of</strong> college coursetaking by high school students <strong>at</strong> their institutions during the 2002–03 12-<br />
month academic year, both within and outside <strong>of</strong> dual enrollment programs. Among institutions with<br />
dual enrollment programs, additional inform<strong>at</strong>ion was obtained on the characteristics <strong>of</strong> programs,<br />
including course loc<strong>at</strong>ion and type <strong>of</strong> instructors, program and course curriculum, academic eligibility<br />
requirements, and funding. <strong>Institutions</strong> with dual enrollment programs were also asked whether they had<br />
1 The summer session included in the 2002–03 12-month academic year (i.e., the summer session <strong>of</strong> 2002 or the summer session <strong>of</strong> 2003) was<br />
whichever one each institution considered to be part <strong>of</strong> th<strong>at</strong> 12-month academic year.<br />
2 More inform<strong>at</strong>ion about PEQIS may be found <strong>at</strong> http://nces.ed.gov/surveys/peqis/.<br />
3 <strong>Institutions</strong> particip<strong>at</strong>ing in Title IV federal student financial aid programs (such as Pell grants or Stafford loans) are accredited by an agency or<br />
organiz<strong>at</strong>ion recognized by the U.S. Department <strong>of</strong> Educ<strong>at</strong>ion, have a program <strong>of</strong> over 300 clock hours or 8 credit hours, have been in business<br />
for <strong>at</strong> least 2 years, and have a signed Program Particip<strong>at</strong>ion Agreement with the Office <strong>of</strong> <strong>Postsecondary</strong> Educ<strong>at</strong>ion (OPE), U.S. Department <strong>of</strong><br />
Educ<strong>at</strong>ion. Degree-granting institutions are those th<strong>at</strong> <strong>of</strong>fer an associ<strong>at</strong>e’s, bachelor’s, master’s, doctoral, or first-pr<strong>of</strong>essional degree (Knapp et<br />
al. 2001).<br />
4 All weighted response r<strong>at</strong>es were calcul<strong>at</strong>ed using the base weight (i.e., the inverse <strong>of</strong> the probability <strong>of</strong> selection).<br />
2
programs specifically geared toward high school students <strong>at</strong> risk <strong>of</strong> educ<strong>at</strong>ion failure; if they answered<br />
yes, they were asked a series <strong>of</strong> questions about the fe<strong>at</strong>ures <strong>of</strong> such special programs.<br />
The primary focus <strong>of</strong> this report is to present n<strong>at</strong>ional estim<strong>at</strong>es on dual enrollment. In<br />
addition, selected survey findings are presented by the following institution characteristics:<br />
• Institution type: public 2-year, priv<strong>at</strong>e 2-year, public 4-year, and priv<strong>at</strong>e 4-year.<br />
Institution type was cre<strong>at</strong>ed from a combin<strong>at</strong>ion <strong>of</strong> level (2-year and 4-year) and control<br />
(public and priv<strong>at</strong>e). Two-year institutions are defined as institutions <strong>at</strong> which the<br />
highest level <strong>of</strong> <strong>of</strong>fering is <strong>at</strong> least 2 but less than 4 years (below the baccalaure<strong>at</strong>e<br />
degree); 4-year institutions are those <strong>at</strong> which the highest level <strong>of</strong> <strong>of</strong>fering is 4 or more<br />
years (baccalaure<strong>at</strong>e or higher degree). Priv<strong>at</strong>e institutions comprise priv<strong>at</strong>e nonpr<strong>of</strong>it<br />
and priv<strong>at</strong>e for-pr<strong>of</strong>it institutions; these institutions are reported together because there<br />
are too few priv<strong>at</strong>e for-pr<strong>of</strong>it institutions in the survey sample to report them as a<br />
separ<strong>at</strong>e c<strong>at</strong>egory.<br />
• Size <strong>of</strong> institution: less than 3,000 students, 3,000 to 9,999 students, and 10,000 or more<br />
students. These are referred to in the text as small, medium, and large institutions,<br />
respectively.<br />
In general, comparisons by these institution characteristics are presented only where<br />
significant differences were detected and follow meaningful p<strong>at</strong>terns. It is important to note th<strong>at</strong> the<br />
characteristics <strong>of</strong> type and size are rel<strong>at</strong>ed to each other. For example, priv<strong>at</strong>e institutions tend to be<br />
smaller than public ones. However, this E.D. TAB report focuses on bivari<strong>at</strong>e rel<strong>at</strong>ionships between the<br />
analysis variables (institution type and size) and questionnaire variables r<strong>at</strong>her than on more complex<br />
analyses. 5<br />
All specific st<strong>at</strong>ements <strong>of</strong> comparison made in this report have been tested for st<strong>at</strong>istical<br />
significance through t-tests and are significant <strong>at</strong> the 95 percent confidence level. However, only selected<br />
findings are presented for each topic in the report. Throughout this report, differences th<strong>at</strong> may appear<br />
large may not be st<strong>at</strong>istically significant due to the rel<strong>at</strong>ively large standard errors surrounding the<br />
estim<strong>at</strong>es (because <strong>of</strong> the small sample size). A detailed description <strong>of</strong> the st<strong>at</strong>istical tests supporting the<br />
survey findings can be found in appendix A.<br />
Interested readers may refer to a companion E.D. TAB report, published by NCES, entitled<br />
<strong>Dual</strong> Credit and Exam-Based Courses in U.S. Public <strong>High</strong> <strong>School</strong>s: 2002–03 (Waits, Setzer, and Lewis<br />
2005). The companion report describes n<strong>at</strong>ionally represent<strong>at</strong>ive findings from a complementary high-<br />
5 E.D. TAB reports focus on the present<strong>at</strong>ion <strong>of</strong> selected descriptive d<strong>at</strong>a in tabular form<strong>at</strong>. This report did not control for the interrel<strong>at</strong>ionships<br />
between the analysis variables <strong>of</strong> institution type and size.<br />
3
school-level survey requested by the Office <strong>of</strong> Voc<strong>at</strong>ional and Adult Educ<strong>at</strong>ion and conducted by NCES<br />
through the Fast Response Survey System (FRSS). Unlike the survey for the current report, which<br />
focused more broadly on dual enrollment, the FRSS survey focused on dual credit, where dual credit was<br />
defined as a course or program where high school students can earn both high school and postsecondary<br />
credits for the same course.<br />
Selected Findings<br />
The findings in this report are organized as follows:<br />
• Prevalence <strong>of</strong> and enrollment in dual enrollment programs and college-level courses<br />
outside <strong>of</strong> dual enrollment programs;<br />
• Characteristics <strong>of</strong> dual enrollment programs and courses, such as loc<strong>at</strong>ion, instructors,<br />
curriculum, eligibility requirements, and funding; and<br />
• <strong>Dual</strong> enrollment programs specifically geared toward students <strong>at</strong> risk <strong>of</strong> educ<strong>at</strong>ion<br />
failure.<br />
Prevalence <strong>of</strong> and <strong>Enrollment</strong> in <strong>Dual</strong> <strong>Enrollment</strong> Programs and College-Level<br />
Courses<br />
The survey asked whether institutions had any high school students who took courses for<br />
college credit during the 2002–03 12-month academic year. <strong>Institutions</strong> th<strong>at</strong> did were then asked whether<br />
high school students took college-level courses outside <strong>of</strong> any dual enrollment program, followed by a<br />
question on whether any high school students took courses for college credit th<strong>at</strong> were part <strong>of</strong> a dual<br />
enrollment program. If any high school students took courses outside <strong>of</strong> or within dual enrollment<br />
programs, institutions were asked to provide the number <strong>of</strong> students who did so.<br />
Prevalence <strong>of</strong> <strong>Dual</strong> <strong>Enrollment</strong> Programs and College Coursetaking<br />
• During the 2002–03 12-month academic year, 57 percent <strong>of</strong> all Title IV degree-granting<br />
institutions had high school students taking courses for college credit within or outside<br />
<strong>of</strong> dual enrollment programs (table 1). Forty-eight percent <strong>of</strong> institutions had dual<br />
enrollment programs for high school students taking college courses, and 31 percent <strong>of</strong><br />
institutions had high school students taking college courses outside <strong>of</strong> such programs.<br />
4
• Of the 57 percent <strong>of</strong> institutions th<strong>at</strong> had high school students who took courses for<br />
college credit during the 2002–03 12-month academic year, 85 percent had high school<br />
students taking courses for college credit in dual enrollment programs, and 55 percent<br />
had students who took college courses outside <strong>of</strong> dual enrollment programs (table 1).<br />
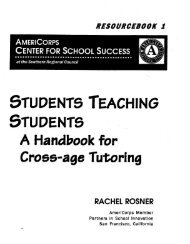
• Of those institutions with any high school students taking courses for college credit,<br />
45 percent had high school students taking college-level courses within dual enrollment<br />
programs only, 15 percent had high school students taking college-level courses outside<br />
<strong>of</strong> dual enrollment programs only, and 40 percent had high school students taking<br />
college-level courses both within and outside <strong>of</strong> those programs (figure 1).<br />
• Ninety-eight percent <strong>of</strong> public 2-year institutions had high school students taking<br />
courses for college credit during the 2002–03 12-month academic year, compared to<br />
77 percent <strong>of</strong> public 4-year institutions, 40 percent <strong>of</strong> priv<strong>at</strong>e 4-year institutions, and<br />
17 percent <strong>of</strong> priv<strong>at</strong>e 2-year institutions (table 1).<br />
Figure 1.<br />
Percentage distribution <strong>of</strong> Title IV degree-granting institutions with any high school<br />
students taking courses for college credit, by whether courses were taken within dual<br />
enrollment programs only, outside <strong>of</strong> dual enrollment programs only, or both within<br />
and outside <strong>of</strong> programs: 12-month academic year, 2002–03<br />
Both within<br />
and outside<br />
<strong>of</strong> dual<br />
enrollment<br />
programs<br />
(40%)<br />
Within dual<br />
enrollment<br />
programs<br />
only<br />
(45%)<br />
Outside <strong>of</strong> dual<br />
enrollment<br />
programs only<br />
(15%)<br />
NOTE: Percentages are based on the 2,410 institutions with any high school students taking courses for college credit (see table 1). Detail may<br />
not sum to totals because <strong>of</strong> rounding.<br />
SOURCE: U.S. Department <strong>of</strong> Educ<strong>at</strong>ion, N<strong>at</strong>ional Center for Educ<strong>at</strong>ion St<strong>at</strong>istics, <strong>Postsecondary</strong> Educ<strong>at</strong>ion Quick Inform<strong>at</strong>ion System<br />
(PEQIS), “<strong>Dual</strong> <strong>Enrollment</strong> Programs and Courses for <strong>High</strong> <strong>School</strong> <strong>Students</strong>,” PEQIS 14, 2004.<br />
5
• Among all institutions, a gre<strong>at</strong>er percentage <strong>of</strong> public 2-year institutions than public 4-<br />
year and priv<strong>at</strong>e 4-year institutions had high school students taking college-level courses<br />
within dual enrollment programs (93 percent versus 64 and 29 percent, respectively)<br />
(table 1). Similarly, a gre<strong>at</strong>er percentage <strong>of</strong> public 2-year institutions than public 4-year<br />
and priv<strong>at</strong>e 4-year institutions had high school students taking college-level courses<br />
outside <strong>of</strong> dual enrollment programs (63 percent versus 40 and 18 percent, respectively).<br />
• Among institutions with high school students taking college-level courses, a higher<br />
percentage <strong>of</strong> public 2-year institutions than public 4-year and priv<strong>at</strong>e 4-year institutions<br />
had high school students taking courses within dual enrollment programs (95 percent<br />
versus 83 and 73 percent, respectively) (table 1). Similarly, among those institutions<br />
with high school students taking college-level courses, a higher percentage <strong>of</strong> public 2-<br />
year institutions than public 4-year and priv<strong>at</strong>e 4-year institutions had high school<br />
students taking courses outside <strong>of</strong> dual enrollment programs (64 percent versus 52 and<br />
45 percent, respectively).<br />
• Forty-four percent <strong>of</strong> small institutions had high school students taking courses for<br />
college credit, compared to 83 percent <strong>of</strong> medium institutions and 94 percent <strong>of</strong> large<br />
institutions (table 1).<br />
• Based on all institutions, a lower percentage <strong>of</strong> small institutions than medium and large<br />
institutions had high school students taking courses for college credit within dual<br />
enrollment programs (36 percent versus 74 and 79 percent, respectively) (table 1). In<br />
addition, based on all institutions, a lower percentage <strong>of</strong> small institutions than medium<br />
and large institutions had high school students taking courses outside <strong>of</strong> dual enrollment<br />
programs (22 percent versus 51 and 50 percent, respectively).<br />
6
<strong>Enrollment</strong> <strong>of</strong> <strong>High</strong> <strong>School</strong> <strong>Students</strong> in <strong>Dual</strong> <strong>Enrollment</strong> Programs and<br />
College-Level Courses<br />
• Overall, approxim<strong>at</strong>ely 813,000 high school students took college-level courses through<br />
postsecondary institutions, either within or outside <strong>of</strong> dual enrollment programs, during<br />
the 2002–03 12-month academic year (table 2). This number represents about 5 percent<br />
<strong>of</strong> all high school students. In fall 2001 (the last year for which d<strong>at</strong>a are available), there<br />
were over 15 million students enrolled in public and priv<strong>at</strong>e high schools in the United<br />
St<strong>at</strong>es (U.S. Department <strong>of</strong> Educ<strong>at</strong>ion 2003).<br />
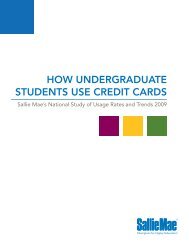
• Approxim<strong>at</strong>ely 680,000 high school students took courses for college credit within dual<br />
enrollment programs (table 2). Fewer high school students (approxim<strong>at</strong>ely 133,000) took<br />
college-level courses outside <strong>of</strong> dual enrollment programs. Thus, 84 percent <strong>of</strong> high<br />
school students who took courses for college credit through postsecondary institutions<br />
did so as part <strong>of</strong> a dual enrollment program (figure 2).<br />
Figure 2.<br />
Percentage distribution <strong>of</strong> high school students taking courses for college credit within<br />
or outside <strong>of</strong> dual enrollment programs: 12-month academic year, 2002–03<br />
<strong>High</strong> school students taking<br />
college courses outside <strong>of</strong><br />
dual enrollment programs<br />
(16%)<br />
<strong>High</strong> school<br />
students<br />
taking<br />
college<br />
courses<br />
within dual<br />
enrollment<br />
programs<br />
(84%)<br />
NOTE: Percentages are based on the 812,700 high school students who took college-level courses <strong>at</strong> the 2,410 Title IV degree-granting<br />
institutions with any high school students taking courses for college credit during the 2002–03 12-month academic year (see table 1 and table 2).<br />
Detail may not sum to totals because <strong>of</strong> rounding.<br />
SOURCE: U.S. Department <strong>of</strong> Educ<strong>at</strong>ion, N<strong>at</strong>ional Center for Educ<strong>at</strong>ion St<strong>at</strong>istics, <strong>Postsecondary</strong> Educ<strong>at</strong>ion Quick Inform<strong>at</strong>ion System<br />
(PEQIS), “<strong>Dual</strong> <strong>Enrollment</strong> Programs and Courses for <strong>High</strong> <strong>School</strong> <strong>Students</strong>,” PEQIS 14, 2004.<br />
7
• Public 2-year institutions had more high school students who took college-level courses<br />
than public 4-year and priv<strong>at</strong>e 4-year institutions during the 2002–03 12-month<br />
academic year (619,000 versus 122,000 and 67,000, respectively) (table 2). Thus,<br />
77 percent <strong>of</strong> high school students who took college-level courses were in public 2-year<br />
institutions, versus 15 percent in public 4-year and 8 percent in priv<strong>at</strong>e 4-year<br />
institutions (figure 3).<br />
• Public 2-year institutions also had more high school students than public 4-year and<br />
priv<strong>at</strong>e 4-year institutions within dual enrollment programs (517,000 versus 100,000 and<br />
60,000, respectively) and outside <strong>of</strong> dual enrollment programs (102,000 versus 22,000<br />
and 7,000, respectively) (table 2).<br />
• Small institutions had fewer high school students taking college-level courses than<br />
medium and large institutions during the 2002–03 12-month academic year (171,000<br />
versus 308,000 and 333,000, respectively) (table 2). Similarly, small institutions had<br />
fewer high school students taking college-level courses than medium and large<br />
institutions, both within dual enrollment programs (149,000 versus 249,000 and<br />
282,000, respectively) and outside <strong>of</strong> dual enrollment programs (23,000 versus 59,000<br />
and 51,000, respectively).<br />
Figure 3.<br />
Percentage distribution <strong>of</strong> high school students taking courses for college credit,<br />
by institution type: 12-month academic year, 2002–03<br />
<strong>High</strong> school<br />
students taking<br />
college courses<br />
<strong>at</strong> public<br />
4-year<br />
institutions<br />
(15%)<br />
<strong>High</strong> school students<br />
taking college courses<br />
<strong>at</strong> priv<strong>at</strong>e 4-year<br />
institutions<br />
(8%)<br />
<strong>High</strong> school<br />
students<br />
taking<br />
college<br />
courses <strong>at</strong><br />
public<br />
2-year<br />
institutions<br />
(77%)<br />
NOTE: Percentages are based on the 812,700 high school students who took college-level courses <strong>at</strong> the 2,410 Title IV degree-granting<br />
institutions with any high school students taking courses for college credit during the 2002–03 12-month academic year (see table 1 and table 2).<br />
D<strong>at</strong>a for priv<strong>at</strong>e 2-year institutions are not reported in a separ<strong>at</strong>e c<strong>at</strong>egory because too few priv<strong>at</strong>e 2-year institutions in the sample had any dual<br />
enrollment <strong>of</strong> high school students in 2002–03 to make reliable estim<strong>at</strong>es. Detail may not sum to totals because <strong>of</strong> rounding.<br />
SOURCE: U.S. Department <strong>of</strong> Educ<strong>at</strong>ion, N<strong>at</strong>ional Center for Educ<strong>at</strong>ion St<strong>at</strong>istics, <strong>Postsecondary</strong> Educ<strong>at</strong>ion Quick Inform<strong>at</strong>ion System<br />
(PEQIS), “<strong>Dual</strong> <strong>Enrollment</strong> Programs and Courses for <strong>High</strong> <strong>School</strong> <strong>Students</strong>,” PEQIS 14, 2004.<br />
8
Characteristics <strong>of</strong> <strong>Dual</strong> <strong>Enrollment</strong> Programs<br />
Those institutions th<strong>at</strong> reported having high school students who took courses for college<br />
credit within dual enrollment programs were asked about the characteristics <strong>of</strong> their programs. The topics<br />
explored in the survey included course loc<strong>at</strong>ion, course instructors, program curriculum, academic<br />
eligibility requirements, and funding.<br />
Course Loc<strong>at</strong>ion and Type <strong>of</strong> Instructors<br />
<strong>Institutions</strong> with dual enrollment programs were asked whether high school students in the<br />
dual enrollment programs took courses on the campus <strong>of</strong> the institution, on a high school campus, or <strong>at</strong><br />
some other loc<strong>at</strong>ion. <strong>Institutions</strong> with courses taught on a high school campus were also asked whether<br />
the courses in the dual enrollment programs were taught by college instructors only, high school<br />
instructors only, or by both high school and college instructors. If institutions indic<strong>at</strong>ed th<strong>at</strong> <strong>at</strong> least some<br />
courses were taught by high school instructors, they were asked how the minimum qualific<strong>at</strong>ions for high<br />
school instructors who taught the courses compared to the qualific<strong>at</strong>ions required for college instructors.<br />
• Among institutions with dual enrollment programs, 80 percent <strong>of</strong>fered courses taken by<br />
high school students on their college campus, 55 percent <strong>of</strong>fered courses on a high<br />
school campus, and 12 percent <strong>of</strong>fered courses <strong>at</strong> some other loc<strong>at</strong>ion 6 (table 3).<br />
• A gre<strong>at</strong>er percentage <strong>of</strong> public 2-year than public 4-year and priv<strong>at</strong>e 4-year institutions<br />
<strong>of</strong>fered the courses taken by high school students on a high school campus (73 percent<br />
versus 47 and 28 percent, respectively) (table 3).<br />
• Of those institutions with dual enrollment programs with courses taught on a high school<br />
campus, 26 percent reported th<strong>at</strong> the courses were taught by college instructors only,<br />
32 percent reported high school instructors only, and 42 percent reported both college<br />
and high school instructors (table 4).<br />
• A smaller percentage <strong>of</strong> priv<strong>at</strong>e 4-year institutions had the courses taught on a high<br />
school campus taught by college instructors only, compared to public 2-year and public<br />
4-year institutions (10 percent versus 28 and 31 percent, respectively) (table 4).<br />
• Of those institutions with dual enrollment programs with <strong>at</strong> least some courses taught by<br />
high school instructors, 86 percent said th<strong>at</strong> the minimum qualific<strong>at</strong>ions for high school<br />
instructors were the same as those required for college instructors, compared to 6 percent<br />
th<strong>at</strong> said th<strong>at</strong> the minimum qualific<strong>at</strong>ions were different (table 5). Four percent <strong>of</strong><br />
6 The percentage <strong>of</strong> institutions with courses for high school students <strong>of</strong>fered on their college campus, on a high school campus, or <strong>at</strong> some other<br />
loc<strong>at</strong>ion sum to more than 100 percent because institutions may have <strong>of</strong>fered courses <strong>at</strong> more than one loc<strong>at</strong>ion. Other loc<strong>at</strong>ions included<br />
community centers, voc<strong>at</strong>ional/technical schools, and hospitals. Respondents also included online courses as “other loc<strong>at</strong>ions.”<br />
9
institutions said th<strong>at</strong> they had no set policy with respect to minimum qualific<strong>at</strong>ions, and<br />
5 percent said th<strong>at</strong> it varied.<br />
• A higher percentage <strong>of</strong> public 2-year institutions than public 4-year institutions reported<br />
the same minimum qualific<strong>at</strong>ions for high school instructors as for college instructors<br />
with respect to teaching college-level courses (90 percent versus 73 percent) (table 5).<br />
Curriculum and Coursetaking P<strong>at</strong>terns<br />
<strong>Institutions</strong> were asked several questions regarding dual enrollment program curriculum and<br />
coursetaking p<strong>at</strong>terns, including the typical coursetaking p<strong>at</strong>tern for high school students and the<br />
maximum number <strong>of</strong> courses allowed per academic term. <strong>Institutions</strong> were also asked whether the<br />
curriculum for courses taken in the programs was specially designed for high school students.<br />
• Among institutions with dual enrollment programs, 48 percent <strong>of</strong> institutions responded<br />
th<strong>at</strong> one course per academic term most closely resembled the typical high school<br />
enrollment p<strong>at</strong>tern during the 2002–03 12-month academic year, compared to 19 percent<br />
th<strong>at</strong> responded two courses per academic term, and 4 percent th<strong>at</strong> responded three or<br />
more courses per academic term (table 6). Twenty-eight percent <strong>of</strong> institutions said th<strong>at</strong><br />
it varied. 7<br />
• A higher percentage <strong>of</strong> public 4-year and priv<strong>at</strong>e 4-year institutions than public 2-year<br />
institutions reported one course per academic term as the typical p<strong>at</strong>tern <strong>of</strong> high school<br />
enrollments (56 and 64 percent, respectively, versus 36 percent) (table 6). A higher<br />
percentage <strong>of</strong> public 2-year institutions than public 4-year and priv<strong>at</strong>e 4-year institutions<br />
reported th<strong>at</strong> the typical p<strong>at</strong>tern varied (37 percent versus 28 and 12 percent,<br />
respectively).<br />
• Fourteen percent <strong>of</strong> institutions with dual enrollment programs said th<strong>at</strong> one course was<br />
the maximum number allowed per academic term, 30 percent reported allowing a<br />
maximum <strong>of</strong> two courses per academic term, and 25 percent reported allowing three or<br />
more courses per academic term (table 7). Another 31 percent <strong>of</strong> institutions said th<strong>at</strong><br />
there was no maximum number <strong>of</strong> courses per academic term.<br />
• A gre<strong>at</strong>er percentage <strong>of</strong> priv<strong>at</strong>e 4-year institutions than public 2-year and public 4-year<br />
institutions allowed a maximum <strong>of</strong> one course per academic term (33 percent versus 5<br />
and 11 percent, respectively) (table 7). Thirty-eight percent <strong>of</strong> public 2-year institutions<br />
had no maximum number <strong>of</strong> courses per academic term, compared to 31 percent <strong>of</strong><br />
public 4-year and 19 percent <strong>of</strong> priv<strong>at</strong>e 4-year institutions.<br />
• A smaller percentage <strong>of</strong> large institutions allowed a maximum <strong>of</strong> one course per<br />
academic term, compared to small and medium institutions (8 percent versus 18 and 11<br />
percent, respectively) (table 7).<br />
7 The “it varied” response could indic<strong>at</strong>e th<strong>at</strong> there was no typical p<strong>at</strong>tern <strong>of</strong> high school enrollments within a single program, or else th<strong>at</strong> multiple<br />
programs within an institution had different typical p<strong>at</strong>terns.<br />
10
• Eighty-nine percent <strong>of</strong> institutions said th<strong>at</strong> the curriculum <strong>of</strong> the college-level courses<br />
taken by high school students as part <strong>of</strong> their dual enrollment programs was the same as<br />
for regular college students, compared to 3 percent <strong>of</strong> institutions th<strong>at</strong> said th<strong>at</strong> the<br />
curriculum was specially designed for high school students, and 8 percent th<strong>at</strong> said it<br />
varied (table 8). 8<br />
Credit Award<br />
<strong>Institutions</strong> were asked about when high school students were generally awarded college<br />
credit for courses taken, and whether they earned credit <strong>at</strong> the high school level for courses taken.<br />
• Ninety-four percent <strong>of</strong> institutions with dual enrollment programs awarded college credit<br />
for courses immedi<strong>at</strong>ely after course completion, compared to 3 percent th<strong>at</strong> awarded<br />
credit upon enrollment <strong>of</strong> students <strong>at</strong> their institutions and another 3 percent th<strong>at</strong><br />
awarded credit in some other way (table 9). 9<br />
• Fifty-nine percent <strong>of</strong> institutions with dual enrollment programs indic<strong>at</strong>ed th<strong>at</strong> credit for<br />
college courses was earned <strong>at</strong> both the high school and college level, compared to<br />
6 percent where credit was earned <strong>at</strong> the college level only, and 21 percent where it<br />
varied (table 10). 10 Fourteen percent <strong>of</strong> institutions did not know whether credit was<br />
earned <strong>at</strong> the high school level.<br />
• A gre<strong>at</strong>er percentage <strong>of</strong> respondents <strong>at</strong> priv<strong>at</strong>e 4-year institutions than <strong>at</strong> public 2-year<br />
and public 4-year institutions did not know whether credit for courses was earned <strong>at</strong> the<br />
high school level (25 percent versus 9 and 14 percent, respectively) (table 10).<br />
Academic Eligibility Requirements<br />
<strong>Institutions</strong> with dual enrollment programs were asked a series <strong>of</strong> questions pertaining to<br />
academic eligibility requirements for high school students to particip<strong>at</strong>e in the dual enrollment programs.<br />
<strong>Institutions</strong> were asked whether they had academic eligibility requirements, wh<strong>at</strong> were the requirements,<br />
and whether their academic eligibility requirements were the same or different than their institutions’<br />
admissions standards for regular college students. In addition, institutions were asked to identify the grade<br />
levels <strong>at</strong> which high school students were eligible to take courses in dual enrollment programs.<br />
8 “It varied” could mean th<strong>at</strong> the curriculum varied within a single program (e.g., was the same as for regular college students for some courses,<br />
but different for others), or else th<strong>at</strong> the curriculum varied across multiple programs within an institution (i.e., was the same as for regular<br />
college students in one program, but specially designed for high school students in another program).<br />
9 Of the roughly 20 “other ways” cited by respondents, about half noted th<strong>at</strong> credits were awarded after high school gradu<strong>at</strong>ion. The remaining<br />
responses varied.<br />
10 The “it varied” response could indic<strong>at</strong>e th<strong>at</strong> credit was earned in various ways within a single program, or else th<strong>at</strong> credit was earned in<br />
different ways across multiple programs within an institution.<br />
11
Prevalence and Type <strong>of</strong> Requirements<br />
• Among institutions with dual enrollment programs, 85 percent had academic eligibility<br />
requirements for high school students to particip<strong>at</strong>e (table 11). A higher percentage <strong>of</strong><br />
public 4-year institutions than public 2-year and priv<strong>at</strong>e 4-year institutions had academic<br />
eligibility requirements (93 percent versus 83 and 81 percent, respectively).<br />
• A higher percentage <strong>of</strong> institutions with dual enrollment programs th<strong>at</strong> had academic<br />
eligibility requirements had a minimum high school grade point average (GPA)<br />
requirement, compared to other kinds <strong>of</strong> requirements (66 percent versus 16 to 45<br />
percent) (Table 11). Forty-five percent <strong>of</strong> the institutions used a minimum score on a<br />
standardized test, 44 percent used a college placement test, and 16 percent used<br />
minimum high school class rank as academic eligibility requirements for high school<br />
students to particip<strong>at</strong>e in dual enrollment programs. Thirty-one percent had some other<br />
academic eligibility requirements, including recommend<strong>at</strong>ions or permission (from a<br />
high school principal, guidance counselor, or a parent/guardian), course prerequisites,<br />
strong high school <strong>at</strong>tendance, junior or senior grade level, or an essay or written letter.<br />
• Public 4-year and priv<strong>at</strong>e 4-year institutions used minimum high school GPA as an<br />
academic eligibility requirement more frequently than 2-year institutions (79 and 86<br />
percent, respectively, versus 46 percent). A higher percentage <strong>of</strong> public 2-year<br />
institutions than public 4-year and priv<strong>at</strong>e 4-year institutions required passing a college<br />
placement test (73 percent versus 22 and 13 percent, respectively) (table 11).<br />
• A gre<strong>at</strong>er percentage <strong>of</strong> public 4-year institutions than public 2-year and priv<strong>at</strong>e 4-year<br />
institutions required a minimum score on a standardized test (60 percent versus 43 and<br />
37 percent, respectively) and a minimum high school class rank (28 percent versus 8 and<br />
19 percent, respectively) (table 11).<br />
Minimum <strong>High</strong> <strong>School</strong> GPA<br />
• Of those institutions with dual enrollment programs th<strong>at</strong> had a minimum high school<br />
GPA requirement, the highest percentage (44 percent) required a minimum GPA<br />
between 2.75 and 3.24, compared to 7 percent th<strong>at</strong> required between 1.75 and 2.24,<br />
10 percent th<strong>at</strong> required between 2.25 and 2.74, 22 percent th<strong>at</strong> required between 3.25<br />
and 3.74, and 3 percent th<strong>at</strong> required a minimum GPA <strong>of</strong> 3.75 or above (table 12).<br />
Fourteen percent <strong>of</strong> institutions said th<strong>at</strong> it varied. 11<br />
• A lower percentage <strong>of</strong> public 2-year institutions than public 4-year and priv<strong>at</strong>e 4-year<br />
institutions required a minimum GPA between 3.25 and 3.74 (15 percent versus 27 and<br />
29 percent, respectively) (table 12).<br />
11 “It varied” could indic<strong>at</strong>e th<strong>at</strong> the minimum GPA varied within a single program, or else th<strong>at</strong> the minimum required GPA was different across<br />
multiple programs within an institution.<br />
12
Comparability <strong>of</strong> Admissions Standards<br />
• Of the 85 percent <strong>of</strong> institutions with dual enrollment programs th<strong>at</strong> had academic<br />
eligibility requirements for high school students to particip<strong>at</strong>e, 38 percent indic<strong>at</strong>ed th<strong>at</strong><br />
their requirements were the same as admissions standards for regular college students,<br />
while 62 percent indic<strong>at</strong>ed th<strong>at</strong> their requirements were different from admissions<br />
standards for regular college students (table 13).<br />
• Fifty-five percent <strong>of</strong> public 2-year institutions reported th<strong>at</strong> their academic eligibility<br />
requirements were the same as admissions standards for regular college students,<br />
compared to 21 percent <strong>of</strong> public 4-year and 27 percent <strong>of</strong> priv<strong>at</strong>e 4-year institutions<br />
(table 13).<br />
Eligible Grade Levels<br />
• Among institutions with dual enrollment programs, 96 percent allowed grade 12 high<br />
school students to take courses in the programs, 12 86 percent allowed grade 11 students,<br />
28 percent allowed grade 10 students, 16 percent allowed grade 9 students, and 2 percent<br />
allowed students in grades lower than grade 9 (table 14).<br />
• A gre<strong>at</strong>er percentage <strong>of</strong> public 2-year institutions than public 4-year and priv<strong>at</strong>e 4-year<br />
institutions allowed grade 9 (21 percent versus 15 and 12 percent, respectively) and<br />
grade 10 high school students (35 percent versus 26 and 18 percent, respectively) to take<br />
courses in dual enrollment programs (table 14). A smaller percentage <strong>of</strong> priv<strong>at</strong>e 4-year<br />
institutions allowed grade 11 high school students to take courses in dual enrollment<br />
programs, compared to public 2-year and public 4-year institutions (76 percent versus 93<br />
and 89 percent, respectively).<br />
• A gre<strong>at</strong>er percentage <strong>of</strong> large than <strong>of</strong> small or medium institutions allowed grade 9<br />
(26 percent versus 14 and 16 percent, respectively), grade 10 (40 percent versus 23 and<br />
30 percent, respectively), and grade 11 (93 percent versus 83 and 88 percent,<br />
respectively) high school students to take courses in dual enrollment programs (table<br />
14).<br />
Funding<br />
<strong>Institutions</strong> with dual enrollment programs were asked two questions rel<strong>at</strong>ing to sources <strong>of</strong><br />
funding for courses taken by high school students in their programs. The first addressed the various<br />
sources for tuition payment, and the second addressed how much high school students (and their parents)<br />
generally paid out <strong>of</strong> pocket for the college-level courses taken as part <strong>of</strong> dual enrollment programs.<br />
• Sixty-four percent <strong>of</strong> institutions with dual enrollment programs reported th<strong>at</strong> parents<br />
and students were a source for tuition for courses taken as part <strong>of</strong> the programs (table<br />
12 Four percent <strong>of</strong> institutions did not allow grade 12 students to particip<strong>at</strong>e in dual enrollment programs, while they did allow students in other<br />
grades (predominantly grade 11) to particip<strong>at</strong>e in dual enrollment programs.<br />
13
15). Thirty-eight percent <strong>of</strong> institutions indic<strong>at</strong>ed th<strong>at</strong> their own postsecondary institution<br />
was a source for tuition (including both actual contributions and tuition waivers),<br />
37 percent said th<strong>at</strong> high schools and public school districts were a source, and<br />
26 percent said th<strong>at</strong> their st<strong>at</strong>e was a source for tuition. 13 Nine percent indic<strong>at</strong>ed th<strong>at</strong><br />
there was some other source(s) for tuition. The most commonly cited other sources<br />
included various federal and county grants, as well as scholarships from local businesses<br />
and nonpr<strong>of</strong>it organiz<strong>at</strong>ions.<br />
• A lower percentage <strong>of</strong> priv<strong>at</strong>e 4-year institutions than public 2-year and public 4-year<br />
institutions indic<strong>at</strong>ed th<strong>at</strong> high schools/public school districts (21 percent versus 45 and<br />
41 percent, respectively) and the st<strong>at</strong>e (15 percent versus 31 and 25 percent,<br />
respectively) were sources for tuition for courses taken in their dual enrollment<br />
programs. However, a higher percentage <strong>of</strong> priv<strong>at</strong>e 4-year institutions than public 2-year<br />
and public 4-year institutions said th<strong>at</strong> their own institution was a source for tuition<br />
(50 percent versus 33 percent each) (table 15).<br />
• A smaller percentage <strong>of</strong> public 2-year institutions reported th<strong>at</strong> parents and students<br />
were a source for tuition for courses taken in dual enrollment programs, compared to<br />
public 4-year and priv<strong>at</strong>e 4-year institutions (56 percent versus 72 and 71 percent,<br />
respectively) (table 15).<br />
• Twenty percent <strong>of</strong> institutions with dual enrollment programs indic<strong>at</strong>ed th<strong>at</strong> students and<br />
parents generally paid full tuition for college-level courses taken in their dual enrollment<br />
programs (table 16). Another 20 percent said th<strong>at</strong> students and parents generally paid<br />
partial tuition. Twenty-three percent said th<strong>at</strong> students and parents generally paid for<br />
books and/or fees only, and 19 percent said th<strong>at</strong> students and parents generally paid<br />
nothing for courses in the dual enrollment programs. Nineteen percent <strong>of</strong> institutions<br />
reported th<strong>at</strong> the amount paid out <strong>of</strong> pocket by students and parents varied. 14<br />
• A gre<strong>at</strong>er percentage <strong>of</strong> public 4-year institutions than public 2-year and priv<strong>at</strong>e 4-year<br />
institutions indic<strong>at</strong>ed th<strong>at</strong> students and parents generally paid full tuition for courses<br />
taken in dual enrollment programs (28 percent versus 20 and 13 percent, respectively)<br />
(table 16). Thirty-eight percent <strong>of</strong> priv<strong>at</strong>e 4-year institutions said th<strong>at</strong> students and<br />
parents generally paid partial tuition out <strong>of</strong> pocket, compared to 10 percent <strong>of</strong> public 2-<br />
year and 17 percent <strong>of</strong> public 4-year institutions.<br />
<strong>Dual</strong> <strong>Enrollment</strong> Programs Specifically for <strong>Students</strong> <strong>at</strong> Risk <strong>of</strong> Educ<strong>at</strong>ion Failure<br />
Some postsecondary institutions have developed programs for <strong>at</strong>-risk students as a way <strong>of</strong><br />
promoting high school retention as well as enthusiasm for educ<strong>at</strong>ion among a popul<strong>at</strong>ion <strong>of</strong> students <strong>at</strong><br />
risk <strong>of</strong> complete withdrawal from the educ<strong>at</strong>ion system. <strong>Institutions</strong> with dual enrollment programs were<br />
asked whether they had a formal dual enrollment program geared specifically toward high school students<br />
13 Multiple sources could have been selected.<br />
14 “It varied” could indic<strong>at</strong>e th<strong>at</strong> the amount paid out <strong>of</strong> pocket by students and parents varied within a single program, or else th<strong>at</strong> the amount<br />
paid varied across multiple programs within an institution.<br />
14
who were <strong>at</strong> risk <strong>of</strong> educ<strong>at</strong>ion failure. If there was a dual enrollment program for <strong>at</strong>-risk high school<br />
students, institutions were then asked about fe<strong>at</strong>ures <strong>of</strong> th<strong>at</strong> program, such as the number <strong>of</strong> students in<br />
the program, the primary focus <strong>of</strong> the program, the typical p<strong>at</strong>tern <strong>of</strong> enrollments, and any extra support<br />
services provided to the <strong>at</strong>-risk students.<br />
• Among the estim<strong>at</strong>ed 2,050 institutions with dual enrollment programs, approxim<strong>at</strong>ely<br />
110 (5 percent) had dual enrollment programs specifically geared toward high school<br />
students <strong>at</strong> risk <strong>of</strong> educ<strong>at</strong>ion failure (table 17). Two percent <strong>of</strong> all institutions had such<br />
programs.<br />
• During the 2002–03 12-month academic year, there were approxim<strong>at</strong>ely 6,400 students<br />
enrolled in dual enrollment programs geared specifically toward high school students <strong>at</strong><br />
risk <strong>of</strong> educ<strong>at</strong>ion failure (not shown in tables). 15<br />
• Thirty-nine percent <strong>of</strong> institutions with dual enrollment programs geared toward students<br />
<strong>at</strong> risk <strong>of</strong> educ<strong>at</strong>ion failure reported th<strong>at</strong> the primary focus <strong>of</strong> the program was<br />
career/technical (figure 4). Thirty-four percent said th<strong>at</strong> the primary focus was academic,<br />
and 21 percent said th<strong>at</strong> the primary focus was equally academic and career/technical.<br />
Six percent reported some other primary focus.<br />
Figure 4.<br />
Percentage distribution <strong>of</strong> Title IV degree-granting institutions with dual enrollment<br />
programs for <strong>at</strong>-risk high school students, by primary focus <strong>of</strong> such programs:<br />
12-month academic year, 2002–03<br />
Equally<br />
academic<br />
and career/<br />
technical<br />
focus<br />
(21%)<br />
Other focus<br />
(6%)<br />
Career/<br />
technical<br />
focus<br />
(39%)<br />
Academic<br />
focus<br />
(34%)<br />
NOTES: Percentages are based on the 110 institutions th<strong>at</strong> had dual enrollment programs for <strong>at</strong>-risk high school students (see table 17). Detail<br />
may not sum to totals because <strong>of</strong> rounding.<br />
SOURCE: U.S. Department <strong>of</strong> Educ<strong>at</strong>ion, N<strong>at</strong>ional Center for Educ<strong>at</strong>ion St<strong>at</strong>istics, <strong>Postsecondary</strong> Educ<strong>at</strong>ion Quick Inform<strong>at</strong>ion System<br />
(PEQIS), “<strong>Dual</strong> <strong>Enrollment</strong> Programs and Courses for <strong>High</strong> <strong>School</strong> <strong>Students</strong>,” PEQIS 14, 2004.<br />
15 Standard error = 1,110.<br />
15
• Forty percent <strong>of</strong> institutions with dual enrollment programs for <strong>at</strong>-risk students indic<strong>at</strong>ed<br />
th<strong>at</strong> the most common p<strong>at</strong>tern <strong>of</strong> enrollments in such programs was one course per<br />
academic term, 14 percent reported two courses per academic term, 8 percent reported<br />
three or more courses per academic term, and 38 percent reported th<strong>at</strong> the number <strong>of</strong><br />
courses students took varied considerably (figure 5).<br />
Figure 5.<br />
Percentage distribution <strong>of</strong> Title IV degree-granting institutions with dual enrollment<br />
programs for <strong>at</strong>-risk high school students, by typical p<strong>at</strong>terns <strong>of</strong> enrollments in such<br />
programs: 12-month academic year, 2002–03<br />
Number <strong>of</strong><br />
courses<br />
varied<br />
considerably<br />
(38%)<br />
One course<br />
per academic<br />
term<br />
(40%)<br />
Three or more<br />
courses per<br />
academic<br />
term<br />
(8%)<br />
Two courses<br />
per academic<br />
term<br />
(14%)<br />
NOTES: Percentages are based on the 110 institutions th<strong>at</strong> had dual enrollment programs for <strong>at</strong>-risk high school students (see table 17). Detail<br />
may not sum to totals because <strong>of</strong> rounding.<br />
SOURCE: U.S. Department <strong>of</strong> Educ<strong>at</strong>ion, N<strong>at</strong>ional Center for Educ<strong>at</strong>ion St<strong>at</strong>istics, <strong>Postsecondary</strong> Educ<strong>at</strong>ion Quick Inform<strong>at</strong>ion System<br />
(PEQIS), “<strong>Dual</strong> <strong>Enrollment</strong> Programs and Courses for <strong>High</strong> <strong>School</strong> <strong>Students</strong>,” PEQIS 14, 2004.<br />
• Sixty percent <strong>of</strong> institutions with programs for <strong>at</strong>-risk students provided extra support<br />
services specifically for the students in the program, such as tutoring, academic advising,<br />
study skills workshops, and precollege counseling (not shown in tables). 16<br />
• Of those institutions with programs for <strong>at</strong>-risk students th<strong>at</strong> provided extra support<br />
services, 84 percent provided academic advising, 82 percent provided tutoring,<br />
76 percent provided study skills workshops, 75 percent <strong>of</strong>fered college<br />
applic<strong>at</strong>ion/selection counseling, 62 percent <strong>of</strong>fered financial aid counseling, and<br />
38 percent <strong>of</strong>fered other support services (figure 6). Mentoring and career counseling<br />
were commonly cited as other support services.<br />
16 Standard error = 8.4. Respondents were asked to include only those support services beyond those usually provided to students taking courses<br />
through their institution.<br />
16
Figure 6.<br />
Percent<br />
100<br />
Percent <strong>of</strong> Title IV degree-granting institutions with dual enrollment programs for <strong>at</strong>risk<br />
high school students th<strong>at</strong> had extra support services, by specific extra support<br />
services: 12-month academic year, 2002–03<br />
84<br />
82<br />
80<br />
76 75<br />
60<br />
62<br />
40<br />
38<br />
20<br />
0<br />
Academic<br />
advising<br />
Tutoring<br />
Study<br />
skills<br />
workshops<br />
College<br />
applic<strong>at</strong>ion/<br />
selection<br />
counseling<br />
Financial<br />
aid<br />
counseling<br />
Other<br />
support<br />
services<br />
NOTES: Percentages are based on the 60 institutions th<strong>at</strong> had dual enrollment programs for <strong>at</strong>-risk high school students and provided extra<br />
support services to students.<br />
SOURCE: U.S. Department <strong>of</strong> Educ<strong>at</strong>ion, N<strong>at</strong>ional Center for Educ<strong>at</strong>ion St<strong>at</strong>istics, <strong>Postsecondary</strong> Educ<strong>at</strong>ion Quick Inform<strong>at</strong>ion System<br />
(PEQIS), “<strong>Dual</strong> <strong>Enrollment</strong> Programs and Courses for <strong>High</strong> <strong>School</strong> <strong>Students</strong>,” PEQIS 14, 2004.<br />
17
This page intentionally left blank.<br />
18
References<br />
Bailey, T.R., and Karp, M. (2003). Promoting College Access and Success: A Review <strong>of</strong> Credit-Based<br />
Transition Programs. U.S. Department <strong>of</strong> Educ<strong>at</strong>ion. Washington, DC: Office <strong>of</strong> Adult and<br />
Voc<strong>at</strong>ional Educ<strong>at</strong>ion.<br />
Clark, R.W. (2001). <strong>Dual</strong> Credit: A Report <strong>of</strong> Programs and Policies Th<strong>at</strong> Offer <strong>High</strong> <strong>School</strong> <strong>Students</strong><br />
College Credits. Se<strong>at</strong>tle, WA: Institute for Educ<strong>at</strong>ional Inquiry.<br />
Karp, M., Bailey, T.R., Hughes, K.L., and Fermin, B.J. (2004). St<strong>at</strong>e <strong>Dual</strong> <strong>Enrollment</strong> Policies:<br />
Addressing Access and Quality. U.S. Department <strong>of</strong> Educ<strong>at</strong>ion. Washington, DC: Office <strong>of</strong> Adult<br />
and Voc<strong>at</strong>ional Educ<strong>at</strong>ion.<br />
Knapp, L.G., Kelly, J.E., Whitmore, R.W., Wu, S., Gallego, L.M., and Grau, E. (2001). <strong>Postsecondary</strong><br />
<strong>Institutions</strong> in the United St<strong>at</strong>es: Fall 2000 and Degrees and Other Awards Conferred: 1999–2000<br />
(NCES 2002–156). U.S. Department <strong>of</strong> Educ<strong>at</strong>ion. Washington, DC: N<strong>at</strong>ional Center for<br />
Educ<strong>at</strong>ion St<strong>at</strong>istics.<br />
U.S. Department <strong>of</strong> Educ<strong>at</strong>ion. N<strong>at</strong>ional Center for Educ<strong>at</strong>ion St<strong>at</strong>istics. (2003). Digest <strong>of</strong> Educ<strong>at</strong>ion<br />
St<strong>at</strong>istics, 2003. Retrieved February 24, 2005, from http://nces.ed.gov/programs/digest/d03/.<br />
Waits, T., Setzer, J.C., and Lewis, L. (2004). <strong>Dual</strong> Credit and Exam-Based Courses in U.S. Public <strong>High</strong><br />
<strong>School</strong>s: 2002–03 (NCES 2005–009). U.S. Department <strong>of</strong> Educ<strong>at</strong>ion. Washington, DC: N<strong>at</strong>ional<br />
Center for Educ<strong>at</strong>ion St<strong>at</strong>istics.<br />
19
This page intentionally left blank.<br />
20
Tables <strong>of</strong> Estim<strong>at</strong>es and Standard Errors<br />
21
Table 1.<br />
Percent <strong>of</strong> Title IV degree-granting institutions with any high school students taking<br />
courses for college credit, within and outside <strong>of</strong> dual enrollment programs,<br />
by institution type and size: 12-month academic year, 2002–03<br />
<strong>Institutions</strong> with any high<br />
school students taking<br />
courses for college credit<br />
<strong>Institutions</strong> with any high school<br />
students taking courses within<br />
dual enrollment programs<br />
<strong>Institutions</strong> with any high school<br />
students taking courses outside <strong>of</strong><br />
dual enrollment programs<br />
Institution type and size<br />
Total<br />
number <strong>of</strong><br />
institutions<br />
Number<br />
Percent<br />
Number <strong>of</strong><br />
institutions<br />
Percent<br />
based on all<br />
institutions<br />
Percent<br />
based on<br />
institutions<br />
with any<br />
high school<br />
students<br />
taking<br />
courses for<br />
college<br />
credit<br />
Number <strong>of</strong><br />
institutions<br />
Percent<br />
based on all<br />
institutions<br />
Percent<br />
based on<br />
institutions<br />
with any<br />
high school<br />
students<br />
taking<br />
courses for<br />
college<br />
credit<br />
All institutions......... 4,240 2,410 57 2,050 48 85 1,310 31 55<br />
Institution type<br />
Public 2-year ............. 1,090 1,070 98 1,020 93 95 680 63 64<br />
Priv<strong>at</strong>e 2-year............ 660 110 17 ‡ ‡ ‡ ‡ ‡ ‡<br />
Public 4-year ............. 630 490 77 400 64 83 250 40 52<br />
Priv<strong>at</strong>e 4-year............ 1,860 750 40 550 29 73 340 18 45<br />
Size <strong>of</strong> institution<br />
Less than 3,000 ......... 2,940 1,290 44 1,070 36 83 660 22 51<br />
3,000 to 9,999 ........... 870 730 83 640 74 89 450 51 61<br />
10,000 or more .......... 420 400 94 340 79 84 210 50 54<br />
‡Reporting standards not met. D<strong>at</strong>a for priv<strong>at</strong>e 2-year institutions are not reported because too few priv<strong>at</strong>e 2-year institutions in the sample had<br />
any dual enrollment <strong>of</strong> high school students in 2002–03 to make reliable estim<strong>at</strong>es. D<strong>at</strong>a for priv<strong>at</strong>e 2-year institutions are included in the totals<br />
and in analyses by institution size.<br />
NOTE: Detail may not sum to totals because <strong>of</strong> rounding or because too few cases were reported for a reliable estim<strong>at</strong>e for priv<strong>at</strong>e 2-year<br />
institutions.<br />
SOURCE: U.S. Department <strong>of</strong> Educ<strong>at</strong>ion, N<strong>at</strong>ional Center for Educ<strong>at</strong>ion St<strong>at</strong>istics, <strong>Postsecondary</strong> Educ<strong>at</strong>ion Quick Inform<strong>at</strong>ion System<br />
(PEQIS), “<strong>Dual</strong> <strong>Enrollment</strong> Programs and Courses for <strong>High</strong> <strong>School</strong> <strong>Students</strong>,” PEQIS 14, 2004.<br />
22
Table 1-A.<br />
Standard errors <strong>of</strong> the percent <strong>of</strong> Title IV degree-granting institutions with any high<br />
school students taking courses for college credit, within and outside <strong>of</strong> dual enrollment<br />
programs, by institution type and size: 12-month academic year, 2002–03<br />
<strong>Institutions</strong> with any high<br />
school students taking<br />
courses for college credit<br />
<strong>Institutions</strong> with any high school<br />
students taking courses within<br />
dual enrollment programs<br />
<strong>Institutions</strong> with any high school<br />
students taking courses outside <strong>of</strong><br />
dual enrollment programs<br />
Institution type and size<br />
Total<br />
number <strong>of</strong><br />
institutions<br />
Number<br />
Percent<br />
Number <strong>of</strong><br />
institutions<br />
Percent<br />
based on all<br />
institutions<br />
Percent<br />
based on<br />
institutions<br />
with any<br />
high school<br />
students<br />
taking<br />
courses for<br />
college<br />
credit<br />
Number <strong>of</strong><br />
institutions<br />
Percent<br />
based on all<br />
institutions<br />
Percent<br />
based on<br />
institutions<br />
with any<br />
high school<br />
students<br />
taking<br />
courses for<br />
college<br />
credit<br />
All institutions......... † 47.6 1.1 48.8 1.2 1.2 52.0 1.2 2.3<br />
Institution type<br />
Public 2-year ............. 3.1 11.3 1.0 14.8 1.3 0.9 26.4 2.4 2.5<br />
Priv<strong>at</strong>e 2-year............ 17.9 25.4 3.8 ‡ ‡ ‡ ‡ ‡ ‡<br />
Public 4-year ............. 4.4 15.4 2.3 15.6 2.4 1.8 15.6 2.5 2.8<br />
Priv<strong>at</strong>e 4-year............ 18.0 32.5 1.8 33.9 1.8 3.5 29.9 1.7 3.6<br />
Size <strong>of</strong> institution<br />
Less than 3,000 ......... 17.3 46.6 1.6 47.0 1.6 2.1 49.2 1.6 4.0<br />
3,000 to 9,999 ........... 17.6 15.0 1.5 17.5 1.7 1.8 18.1 2.1 2.3<br />
10,000 or more .......... 5.1 5.1 0.1 4.8 0.3 0.2 3.0 0.2 0.1<br />
†Not applicable. The PEQIS sample was poststr<strong>at</strong>ified to current IPEDS frame counts, and so the weighted total number <strong>of</strong> institutions<br />
reproduces the IPEDS frame counts and is not subject to sampling error.<br />
‡Reporting standards not met. D<strong>at</strong>a for priv<strong>at</strong>e 2-year institutions are not reported because too few priv<strong>at</strong>e 2-year institutions in the sample had<br />
any dual enrollment <strong>of</strong> high school students in 2002-03 to make reliable estim<strong>at</strong>es. D<strong>at</strong>a for priv<strong>at</strong>e 2-year institutions are included in the totals<br />
and in analyses by institution size.<br />
SOURCE: U.S. Department <strong>of</strong> Educ<strong>at</strong>ion, N<strong>at</strong>ional Center for Educ<strong>at</strong>ion St<strong>at</strong>istics, <strong>Postsecondary</strong> Educ<strong>at</strong>ion Quick Inform<strong>at</strong>ion System<br />
(PEQIS), “<strong>Dual</strong> <strong>Enrollment</strong> Programs and Courses for <strong>High</strong> <strong>School</strong> <strong>Students</strong>,” PEQIS 14, 2004.<br />
23
Table 2.<br />
Number <strong>of</strong> high school students who took college-level courses through Title IV degreegranting<br />
institutions, within and outside <strong>of</strong> dual enrollment programs, by institution type<br />
and size: 12-month academic year, 2002–03<br />
Institution type and size<br />
<strong>High</strong> school students who took<br />
courses within and outside <strong>of</strong><br />
dual enrollment programs<br />
<strong>High</strong> school students who took<br />
courses within dual<br />
enrollment programs<br />
<strong>High</strong> school students who took<br />
courses outside <strong>of</strong> dual<br />
enrollment programs<br />
All institutions......................................... 812,700 1 679,500 133,100<br />
Institution type 2<br />
Public 2-year ............................................. 619,100 516,900 102,200<br />
Public 4-year ............................................. 121,600 99,600 22,000<br />
Priv<strong>at</strong>e 4-year............................................ 66,600 59,900 6,800<br />
Size <strong>of</strong> institution<br />
Less than 3,000 ......................................... 171,300 148,800 22,500<br />
3,000 to 9,999 ........................................... 308,200 249,000 59,200<br />
10,000 or more .......................................... 333,200 281,700 51,500<br />
1 This number represents about 5 percent <strong>of</strong> all high school students. In fall 2001 (the last year for which d<strong>at</strong>a are available), there were over 15<br />
million students enrolled in public and priv<strong>at</strong>e high schools in the United St<strong>at</strong>es (U.S. Department <strong>of</strong> Educ<strong>at</strong>ion).<br />
2 D<strong>at</strong>a for priv<strong>at</strong>e 2-year institutions are not reported in a separ<strong>at</strong>e c<strong>at</strong>egory because too few priv<strong>at</strong>e 2-year institutions in the sample had any dual<br />
enrollment <strong>of</strong> high school students in 2002–03 to make reliable estim<strong>at</strong>es. D<strong>at</strong>a for priv<strong>at</strong>e 2-year institutions are included in the totals and in<br />
analyses by institution size.<br />
NOTE: <strong>High</strong> school students may have been counted twice if they took courses both within and outside <strong>of</strong> dual enrollment programs <strong>at</strong> the same<br />
institution. Detail may not sum to totals because <strong>of</strong> rounding or because too few cases were reported for a reliable estim<strong>at</strong>e for priv<strong>at</strong>e 2-year<br />
institutions.<br />
SOURCE: U.S. Department <strong>of</strong> Educ<strong>at</strong>ion, N<strong>at</strong>ional Center for Educ<strong>at</strong>ion St<strong>at</strong>istics, <strong>Postsecondary</strong> Educ<strong>at</strong>ion Quick Inform<strong>at</strong>ion System<br />
(PEQIS), “<strong>Dual</strong> <strong>Enrollment</strong> Programs and Courses for <strong>High</strong> <strong>School</strong> <strong>Students</strong>,” PEQIS 14, 2004.<br />
24
Table 2-A.<br />
Standard errors <strong>of</strong> the number <strong>of</strong> high school students who took college-level courses<br />
through Title IV degree-granting institutions, within and outside <strong>of</strong> dual enrollment<br />
programs, by institution type and size: 12-month academic year, 2002–03<br />
Institution type and size<br />
<strong>High</strong> school students who took<br />
courses within and outside <strong>of</strong><br />
dual enrollment programs<br />
<strong>High</strong> school students who took<br />
courses within dual<br />
enrollment programs<br />
<strong>High</strong> school students who took<br />
courses outside <strong>of</strong> dual<br />
enrollment programs<br />
All institutions......................................... 24,800 20,390 11,930<br />
Institution type<br />
Public 2-year ............................................. 16,660 15,700 5,750<br />
Public 4-year ............................................. 11,460 5,850 9,280<br />
Priv<strong>at</strong>e 4-year............................................ 9,000 8,970 1,160<br />
Size <strong>of</strong> institution<br />
Less than 3,000 ......................................... 15,240 14,860 3,740<br />
3,000 to 9,999 ........................................... 18,470 13,300 11,130<br />
10,000 or more .......................................... 8,030 6,590 1,150<br />
SOURCE: U.S. Department <strong>of</strong> Educ<strong>at</strong>ion, N<strong>at</strong>ional Center for Educ<strong>at</strong>ion St<strong>at</strong>istics, <strong>Postsecondary</strong> Educ<strong>at</strong>ion Quick Inform<strong>at</strong>ion System<br />
(PEQIS), “<strong>Dual</strong> <strong>Enrollment</strong> Programs and Courses for <strong>High</strong> <strong>School</strong> <strong>Students</strong>,” PEQIS 14, 2004.<br />
25
Table 3.<br />
Percent <strong>of</strong> Title IV degree-granting institutions with dual enrollment programs<br />
indic<strong>at</strong>ing the loc<strong>at</strong>ion <strong>of</strong> courses taken by high school students in the dual enrollment<br />
programs, by institution type and size: 12-month academic year, 2002–03<br />
Institution type and size A college campus A high school campus Some other loc<strong>at</strong>ion 1<br />
All institutions.................................. 80 55 12<br />
Institution type 2<br />
Public 2-year ...................................... 79 73 16<br />
Public 4-year ...................................... 81 47 11<br />
Priv<strong>at</strong>e 4-year..................................... 83 28 8<br />
Size <strong>of</strong> institution<br />
Less than 3,000 .................................. 79 49 10<br />
3,000 to 9,999 .................................... 82 63 13<br />
10,000 or more ................................... 83 57 16<br />
1 Loc<strong>at</strong>ions besides college or high school campuses included community centers, voc<strong>at</strong>ional/technical schools, and hospitals. Respondents also<br />
included online courses as “other loc<strong>at</strong>ions.”<br />
2 D<strong>at</strong>a for priv<strong>at</strong>e 2-year institutions are not reported in a separ<strong>at</strong>e c<strong>at</strong>egory because too few priv<strong>at</strong>e 2-year institutions in the sample had any dual<br />
enrollment <strong>of</strong> high school students in 2002–03 to make reliable estim<strong>at</strong>es. D<strong>at</strong>a for priv<strong>at</strong>e 2-year institutions are included in the totals and in<br />
analyses by institution size.<br />
NOTE: Percentages are based on the 2,050 institutions with dual enrollment programs (see table 1). Percentages do not sum to 100 because<br />
courses could have been <strong>of</strong>fered by institutions <strong>at</strong> multiple loc<strong>at</strong>ions.<br />
SOURCE: U.S. Department <strong>of</strong> Educ<strong>at</strong>ion, N<strong>at</strong>ional Center for Educ<strong>at</strong>ion St<strong>at</strong>istics, <strong>Postsecondary</strong> Educ<strong>at</strong>ion Quick Inform<strong>at</strong>ion System<br />
(PEQIS), “<strong>Dual</strong> <strong>Enrollment</strong> Programs and Courses for <strong>High</strong> <strong>School</strong> <strong>Students</strong>,” PEQIS 14, 2004.<br />
26
Table 3-A.<br />
Standard errors <strong>of</strong> the percent <strong>of</strong> Title IV degree-granting institutions with dual<br />
enrollment programs indic<strong>at</strong>ing the loc<strong>at</strong>ion <strong>of</strong> courses taken by high school students<br />
in the dual enrollment programs, by institution type and size: 12-month academic<br />
year, 2002–03<br />
Institution type and size A college campus A high school campus Some other loc<strong>at</strong>ion<br />
All institutions.................................. 1.9 2.3 1.2<br />
Institution type<br />
Public 2-year ...................................... 2.4 2.6 1.9<br />
Public 4-year ...................................... 2.5 2.6 1.6<br />
Priv<strong>at</strong>e 4-year..................................... 2.9 3.6 3.0<br />
Size <strong>of</strong> institution<br />
Less than 3,000 .................................. 3.4 4.1 2.0<br />
3,000 to 9,999 .................................... 2.0 2.4 2.1<br />
10,000 or more ................................... 0.0 0.3 0.1<br />
SOURCE: U.S. Department <strong>of</strong> Educ<strong>at</strong>ion, N<strong>at</strong>ional Center for Educ<strong>at</strong>ion St<strong>at</strong>istics, <strong>Postsecondary</strong> Educ<strong>at</strong>ion Quick Inform<strong>at</strong>ion System<br />
(PEQIS), “<strong>Dual</strong> <strong>Enrollment</strong> Programs and Courses for <strong>High</strong> <strong>School</strong> <strong>Students</strong>,” PEQIS 14, 2004.<br />
27
Table 4.<br />
Number <strong>of</strong> Title IV degree-granting institutions reporting <strong>at</strong> least some courses taught<br />
on a high school campus, and the percentage distribution <strong>of</strong> institutions indic<strong>at</strong>ing the<br />
type <strong>of</strong> course instructors who taught these courses, by institution type and size:<br />
12-month academic year, 2002–03<br />
Institution type and size<br />
Total number <strong>of</strong><br />
institutions with dual<br />
enrollment programs<br />
with <strong>at</strong> least some<br />
courses taught on a<br />
high school campus<br />
Percentage distribution <strong>of</strong> institutions indic<strong>at</strong>ing the instructors <strong>of</strong> the<br />
college-level courses taught on high school campuses<br />
College instructors<br />
<strong>High</strong> school Both college and<br />
only instructors only high school instructors<br />
All institutions.................................... 1,120 26 32 42<br />
Institution type 1<br />
Public 2-year ........................................ 740 28 26 47<br />
Public 4-year ........................................ 190 31 36 33<br />
Priv<strong>at</strong>e 4-year....................................... 150 10 51 39<br />
Size <strong>of</strong> institution<br />
Less than 3,000 .................................... 530 28 35 37<br />
3,000 to 9,999 ...................................... 400 22 30 48<br />
10,000 or more ..................................... 190 29 30 42<br />
1 D<strong>at</strong>a for priv<strong>at</strong>e 2-year institutions are not reported in a separ<strong>at</strong>e c<strong>at</strong>egory because too few priv<strong>at</strong>e 2-year institutions in the sample had any dual<br />
enrollment <strong>of</strong> high school students in 2002–03 to make reliable estim<strong>at</strong>es. D<strong>at</strong>a for priv<strong>at</strong>e 2-year institutions are included in the totals and in<br />
analyses by institution size.<br />
NOTE: The last three columns <strong>of</strong> table 4 are based on the 1,120 institutions with dual enrollment programs th<strong>at</strong> had <strong>at</strong> least some college-level<br />
courses taught on a high school campus (55 percent). Detail may not sum to totals because <strong>of</strong> rounding or because too few cases were reported for<br />
a reliable estim<strong>at</strong>e for priv<strong>at</strong>e 2-year institutions.<br />
SOURCE: U.S. Department <strong>of</strong> Educ<strong>at</strong>ion, N<strong>at</strong>ional Center for Educ<strong>at</strong>ion St<strong>at</strong>istics, <strong>Postsecondary</strong> Educ<strong>at</strong>ion Quick Inform<strong>at</strong>ion System<br />
(PEQIS), “<strong>Dual</strong> <strong>Enrollment</strong> Programs and Courses for <strong>High</strong> <strong>School</strong> <strong>Students</strong>,” PEQIS 14, 2004.<br />
28
Table 4-A.<br />
Standard errors <strong>of</strong> the number <strong>of</strong> Title IV degree-granting institutions reporting <strong>at</strong><br />
least some courses taught on a high school campus, and the percentage distribution <strong>of</strong><br />
institutions indic<strong>at</strong>ing the type <strong>of</strong> course instructors who taught these courses, by<br />
institution type and size: 12-month academic year, 2002–03<br />
Institution type and size<br />
Total number <strong>of</strong><br />
institutions with dual<br />
enrollment programs<br />
with <strong>at</strong> least some<br />
courses taught on a<br />
high school campus<br />
Percentage distribution <strong>of</strong> institutions indic<strong>at</strong>ing the instructors <strong>of</strong> the<br />
college-level courses taught on high school campuses<br />
College instructors<br />
<strong>High</strong> school Both college and<br />
only instructors only high school instructors<br />
All institutions.................................. 41.7 2.2 2.5 2.7<br />
Institution type<br />
Public 2-year ...................................... 27.9 2.8 2.5 2.5<br />
Public 4-year ...................................... 13.2 4.0 4.0 4.3<br />
Priv<strong>at</strong>e 4-year..................................... 20.6 3.6 8.5 7.6<br />
Size <strong>of</strong> institution<br />
Less than 3,000 .................................. 38.0 4.3 4.6 4.8<br />
3,000 to 9,999 .................................... 18.2 2.8 3.4 4.0<br />
10,000 or more ................................... 3.6 0.1 0.1 0.1<br />
SOURCE: U.S. Department <strong>of</strong> Educ<strong>at</strong>ion, N<strong>at</strong>ional Center for Educ<strong>at</strong>ion St<strong>at</strong>istics, <strong>Postsecondary</strong> Educ<strong>at</strong>ion Quick Inform<strong>at</strong>ion System<br />
(PEQIS), “<strong>Dual</strong> <strong>Enrollment</strong> Programs and Courses for <strong>High</strong> <strong>School</strong> <strong>Students</strong>,” PEQIS 14, 2004.<br />
29
Table 5.<br />
Number <strong>of</strong> Title IV degree-granting institutions reporting <strong>at</strong> least some courses taught<br />
by high school instructors, and the percentage distribution <strong>of</strong> institutions indic<strong>at</strong>ing the<br />
minimum qualific<strong>at</strong>ions for high school instructors who taught these courses, by<br />
institution type and size: 12-month academic year, 2002–03<br />
Institution type and size<br />
Total number <strong>of</strong><br />
institutions with<br />
<strong>at</strong> least some<br />
courses taught by<br />
high school<br />
instructors in<br />
dual enrollment<br />
programs<br />
Percentage distribution <strong>of</strong> institutions indic<strong>at</strong>ing minimum qualific<strong>at</strong>ions for high<br />
school instructors teaching courses for college credit<br />
Same as those Different than<br />
required for those required for<br />
college instructors college instructors No set policy It varied<br />
All institutions.................................. 830 86 6 4 5<br />
Institution type 1<br />
Public 2-year ...................................... 540 90 4 4 2<br />
Public 4-year ...................................... 130 73 14 2 11<br />
Priv<strong>at</strong>e 4-year..................................... 140 81 5 6 8<br />
Size <strong>of</strong> institution<br />
Less than 3,000 .................................. 380 86 7 4 3<br />
3,000 to 9,999 .................................... 320 88 4 3 5<br />
10,000 or more ................................... 140 83 4 5 9<br />
1 D<strong>at</strong>a for priv<strong>at</strong>e 2-year institutions are not reported in a separ<strong>at</strong>e c<strong>at</strong>egory because too few priv<strong>at</strong>e 2-year institutions in the sample had any dual<br />
enrollment <strong>of</strong> high school students in 2002–03 to make reliable estim<strong>at</strong>es. D<strong>at</strong>a for priv<strong>at</strong>e 2-year institutions are included in the totals and in<br />
analyses by institution size.<br />
NOTE: The last four columns <strong>of</strong> table 4 are based on the 830 institutions with dual enrollment programs th<strong>at</strong> had <strong>at</strong> least some courses in the<br />
program taught by high school instructors (74 percent). Detail may not sum to totals because <strong>of</strong> rounding or because too few cases were reported<br />
for a reliable estim<strong>at</strong>e for priv<strong>at</strong>e 2-year institutions.<br />
SOURCE: U.S. Department <strong>of</strong> Educ<strong>at</strong>ion, N<strong>at</strong>ional Center for Educ<strong>at</strong>ion St<strong>at</strong>istics, <strong>Postsecondary</strong> Educ<strong>at</strong>ion Quick Inform<strong>at</strong>ion System<br />
(PEQIS), “<strong>Dual</strong> <strong>Enrollment</strong> Programs and Courses for <strong>High</strong> <strong>School</strong> <strong>Students</strong>,” PEQIS 14, 2004.<br />
30
Table 5-A. Standard errors <strong>of</strong> the number <strong>of</strong> Title IV degree-granting institutions reporting <strong>at</strong><br />
least some courses taught by high school instructors, and the percentage distribution<br />
<strong>of</strong> institutions indic<strong>at</strong>ing the minimum qualific<strong>at</strong>ions for high school instructors who<br />
taught these courses, by institution type and size: 12-month academic year, 2002–03<br />
Institution type and size<br />
Total number <strong>of</strong><br />
institutions with<br />
<strong>at</strong> least some<br />
courses taught by<br />
high school<br />
instructors in<br />
dual enrollment<br />
programs<br />
Percentage distribution <strong>of</strong> institutions indic<strong>at</strong>ing minimum qualific<strong>at</strong>ions for high<br />
school instructors teaching courses for college credit<br />
Same as those Different than<br />
required for those required for<br />
college instructors college instructors No set policy It varied<br />
All institutions.................................. 40.8 1.8 1.1 0.9 1.0<br />
Institution type<br />
Public 2-year ...................................... 26.4 2.0 1.3 1.2 0.9<br />
Public 4-year ...................................... 12.4 4.4 4.2 0.2 3.5<br />
Priv<strong>at</strong>e 4-year..................................... 20.4 5.3 3.0 3.1 3.8<br />
Size <strong>of</strong> institution<br />
Less than 3,000 .................................. 35.9 3.2 2.2 1.6 1.7<br />
3,000 to 9,999 .................................... 20.4 2.9 1.3 1.2 1.9<br />
10,000 or more................................... 2.5 0.2 0.1 0.0 0.1<br />
SOURCE: U.S. Department <strong>of</strong> Educ<strong>at</strong>ion, N<strong>at</strong>ional Center for Educ<strong>at</strong>ion St<strong>at</strong>istics, <strong>Postsecondary</strong> Educ<strong>at</strong>ion Quick Inform<strong>at</strong>ion System<br />
(PEQIS), “<strong>Dual</strong> <strong>Enrollment</strong> Programs and Courses for <strong>High</strong> <strong>School</strong> <strong>Students</strong>,” PEQIS 14, 2004.<br />
31
Table 6.<br />
Percentage distribution <strong>of</strong> Title IV degree-granting institutions with dual enrollment<br />
programs indic<strong>at</strong>ing the typical p<strong>at</strong>tern <strong>of</strong> high school enrollments per academic term,<br />
by institution type and size: 12-month academic year, 2002–03<br />
Institution type and size<br />
Typical p<strong>at</strong>tern <strong>of</strong> high school enrollments in dual enrollment programs<br />
Three or more<br />
One course per Two courses per<br />
courses per<br />
academic term academic term academic term It varied 1<br />
All institutions.................................. 48 19 4 28<br />
Institution type 2<br />
Public 2-year ...................................... 36 23 3 37<br />
Public 4-year ...................................... 56 12 3 28<br />
Priv<strong>at</strong>e 4-year..................................... 64 16 4 12<br />
Size <strong>of</strong> institution<br />
Less than 3,000 .................................. 51 19 4 23<br />
3,000 to 9,999 .................................... 44 19 3 33<br />
10,000 or more ................................... 48 17 2 31<br />
1 The “it varied” response could indic<strong>at</strong>e th<strong>at</strong> there was no typical p<strong>at</strong>tern <strong>of</strong> high school enrollments within a single program, or else th<strong>at</strong> multiple<br />
programs within an institution had different typical p<strong>at</strong>terns.<br />
2 D<strong>at</strong>a for priv<strong>at</strong>e 2-year institutions are not reported in a separ<strong>at</strong>e c<strong>at</strong>egory because too few priv<strong>at</strong>e 2-year institutions in the sample had any dual<br />
enrollment <strong>of</strong> high school students in 2002–03 to make reliable estim<strong>at</strong>es. D<strong>at</strong>a for priv<strong>at</strong>e 2-year institutions are included in the totals and in<br />
analyses by institution size.<br />
NOTE: Percentages are based on the 2,050 institutions with dual enrollment programs (see table 1). Detail may not sum to totals because <strong>of</strong><br />
rounding and because the 1 percent <strong>of</strong> institutions with dual enrollment programs th<strong>at</strong> responded th<strong>at</strong> there was “some other p<strong>at</strong>tern” <strong>of</strong> high<br />
school enrollments are not presented in this table.<br />
SOURCE: U.S. Department <strong>of</strong> Educ<strong>at</strong>ion, N<strong>at</strong>ional Center for Educ<strong>at</strong>ion St<strong>at</strong>istics, <strong>Postsecondary</strong> Educ<strong>at</strong>ion Quick Inform<strong>at</strong>ion System<br />
(PEQIS), “<strong>Dual</strong> <strong>Enrollment</strong> Programs and Courses for <strong>High</strong> <strong>School</strong> <strong>Students</strong>,” PEQIS 14, 2004.<br />
32
Table 6-A.<br />
Standard errors <strong>of</strong> the percentage distribution <strong>of</strong> Title IV degree-granting institutions<br />
with dual enrollment programs indic<strong>at</strong>ing the typical p<strong>at</strong>tern <strong>of</strong> high school<br />
enrollments per academic term, by institution type and size: 12-month academic year,<br />
2002–03<br />
Institution type and size<br />
Typical p<strong>at</strong>tern <strong>of</strong> high school enrollments in dual enrollment programs<br />
Three or more<br />
One course per Two courses per<br />
courses per<br />
academic term academic term academic term<br />
It varied<br />
All institutions.................................. 2.0 1.5 1.0 1.4<br />
Institution type<br />
Public 2-year ...................................... 2.6 2.5 1.0 2.4<br />
Public 4-year ...................................... 2.7 1.7 0.7 2.5<br />
Priv<strong>at</strong>e 4-year..................................... 5.2 3.1 2.1 2.0<br />
Size <strong>of</strong> institution<br />
Less than 3,000 .................................. 3.4 2.5 1.8 2.2<br />
3,000 to 9,999 .................................... 2.8 2.3 0.8 2.5<br />
10,000 or more ................................... 0.2 0.1 0.1 0.1<br />
SOURCE: U.S. Department <strong>of</strong> Educ<strong>at</strong>ion, N<strong>at</strong>ional Center for Educ<strong>at</strong>ion St<strong>at</strong>istics, <strong>Postsecondary</strong> Educ<strong>at</strong>ion Quick Inform<strong>at</strong>ion System<br />
(PEQIS), “<strong>Dual</strong> <strong>Enrollment</strong> Programs and Courses for <strong>High</strong> <strong>School</strong> <strong>Students</strong>,” PEQIS 14, 2004.<br />
33
Table 7.<br />
Percentage distribution <strong>of</strong> Title IV degree-granting institutions with dual enrollment<br />
programs indic<strong>at</strong>ing the maximum number <strong>of</strong> allowable courses per academic term, by<br />
institution type and size: 12-month academic year, 2002–03<br />
Institution type and size<br />
Maximum number <strong>of</strong> courses for high school students per academic term<br />
Three or more<br />
One course per Two courses per<br />
courses per<br />
academic term academic term academic term<br />
No maximum<br />
All institutions.................................. 14 30 25 31<br />
Institution type 1<br />
Public 2-year ...................................... 5 30 26 38<br />
Public 4-year ...................................... 11 32 27 31<br />
Priv<strong>at</strong>e 4-year..................................... 33 28 20 19<br />
Size <strong>of</strong> institution<br />
Less than 3,000 .................................. 18 27 23 31<br />
3,000 to 9,999 .................................... 11 30 27 32<br />
10,000 or more ................................... 8 36 28 28<br />
1 D<strong>at</strong>a for priv<strong>at</strong>e 2-year institutions are not reported in a separ<strong>at</strong>e c<strong>at</strong>egory because too few priv<strong>at</strong>e 2-year institutions in the sample had any dual<br />
enrollment <strong>of</strong> high school students in 2002–03 to make reliable estim<strong>at</strong>es. D<strong>at</strong>a for priv<strong>at</strong>e 2-year institutions are included in the totals and in<br />
analyses by institution size.<br />
NOTE: Percentages are based on the 2,050 institutions with dual enrollment programs (see table 1). Detail may not sum to totals because <strong>of</strong><br />
rounding.<br />
SOURCE: U.S. Department <strong>of</strong> Educ<strong>at</strong>ion, N<strong>at</strong>ional Center for Educ<strong>at</strong>ion St<strong>at</strong>istics, <strong>Postsecondary</strong> Educ<strong>at</strong>ion Quick Inform<strong>at</strong>ion System<br />
(PEQIS), “<strong>Dual</strong> <strong>Enrollment</strong> Programs and Courses for <strong>High</strong> <strong>School</strong> <strong>Students</strong>,” PEQIS 14, 2004.<br />
34
Table 7-A.<br />
Standard errors <strong>of</strong> the percentage distribution <strong>of</strong> Title IV degree-granting institutions<br />
with dual enrollment programs indic<strong>at</strong>ing the maximum number <strong>of</strong> allowable courses<br />
per academic term, by institution type and size: 12-month academic year, 2002–03<br />
Institution type and size<br />
Maximum number <strong>of</strong> courses for high school students per academic term<br />
Three or more<br />
One course per Two courses per<br />
courses per<br />
academic term academic term academic term<br />
No maximum<br />
All institutions.................................. 1.8 1.9 1.5 1.7<br />
Institution type<br />
Public 2-year ...................................... 1.7 3.1 2.3 2.7<br />
Public 4-year ...................................... 2.1 2.7 2.2 2.7<br />
Priv<strong>at</strong>e 4-year..................................... 5.2 3.0 3.8 4.1<br />
Size <strong>of</strong> institution<br />
Less than 3,000 .................................. 3.3 3.4 2.4 3.1<br />
3,000 to 9,999 .................................... 1.5 2.3 2.6 1.8<br />
10,000 or more ................................... 0.1 0.1 0.1 0.2<br />
SOURCE: U.S. Department <strong>of</strong> Educ<strong>at</strong>ion, N<strong>at</strong>ional Center for Educ<strong>at</strong>ion St<strong>at</strong>istics, <strong>Postsecondary</strong> Educ<strong>at</strong>ion Quick Inform<strong>at</strong>ion System<br />
(PEQIS), “<strong>Dual</strong> <strong>Enrollment</strong> Programs and Courses for <strong>High</strong> <strong>School</strong> <strong>Students</strong>,” PEQIS 14, 2004.<br />
35
Table 8.<br />
Percentage distribution <strong>of</strong> Title IV degree-granting institutions with dual enrollment<br />
programs indic<strong>at</strong>ing whether the curriculum <strong>of</strong> programs was specially designed for high<br />
school students or the same as for regular college students, by institution type and size:<br />
12-month academic year, 2002–03<br />
Institution type and size<br />
The same as for regular<br />
college students<br />
Specially designed<br />
for high school students It varied 1<br />
All institutions.................................. 89 3 8<br />
Institution type 2<br />
Public 2-year ...................................... 88 2 10<br />
Public 4-year ...................................... 92 ‡ 7<br />
Priv<strong>at</strong>e 4-year..................................... 87 7 7<br />
Size <strong>of</strong> institution<br />
Less than 3,000 .................................. 90 3 7<br />
3,000 to 9,999 .................................... 86 3 11<br />
10,000 or more ................................... 93 1 6<br />
‡Reporting standards not met. Too few cases for a reliable estim<strong>at</strong>e.<br />
1 “It varied” could mean th<strong>at</strong> the curriculum varied within a single program (e.g., was the same as for regular college students for some courses,<br />
but different for others), or else th<strong>at</strong> the curriculum varied across multiple programs within an institution (i.e., was the same as for regular college<br />
students in one program, but specially designed for high school students in another program).<br />
2 D<strong>at</strong>a for priv<strong>at</strong>e 2-year institutions are not reported in a separ<strong>at</strong>e c<strong>at</strong>egory because too few priv<strong>at</strong>e 2-year institutions in the sample had any dual<br />
enrollment <strong>of</strong> high school students in 2002–03 to make reliable estim<strong>at</strong>es. D<strong>at</strong>a for priv<strong>at</strong>e 2-year institutions are included in the totals and in<br />
analyses by institution size.<br />
NOTE: Percentages are based on the 2,050 institutions with dual enrollment programs (see table 1).<br />
SOURCE: U.S. Department <strong>of</strong> Educ<strong>at</strong>ion, N<strong>at</strong>ional Center for Educ<strong>at</strong>ion St<strong>at</strong>istics, <strong>Postsecondary</strong> Educ<strong>at</strong>ion Quick Inform<strong>at</strong>ion System<br />
(PEQIS), “<strong>Dual</strong> <strong>Enrollment</strong> Programs and Courses for <strong>High</strong> <strong>School</strong> <strong>Students</strong>,” PEQIS 14, 2004.<br />
36
Table 8-A.<br />
Standard errors <strong>of</strong> the percentage distribution <strong>of</strong> Title IV degree-granting institutions<br />
with dual enrollment programs indic<strong>at</strong>ing whether the curriculum <strong>of</strong> programs was<br />
specially designed for high school students or the same as for regular college students,<br />
by institution type and size: 12-month academic year, 2002–03<br />
Institution type and size<br />
The same as for regular<br />
college students<br />
Specially designed<br />
for high school students<br />
It varied<br />
All institutions.................................. 1.4 0.7 1.2<br />
Institution type<br />
Public 2-year ...................................... 2.2 0.9 1.7<br />
Public 4-year ...................................... 1.6 ‡ 1.5<br />
Priv<strong>at</strong>e 4-year..................................... 3.2 2.3 2.1<br />
Size <strong>of</strong> institution<br />
Less than 3,000 .................................. 2.4 1.2 2.1<br />
3,000 to 9,999 .................................... 1.7 0.7 1.5<br />
10,000 or more ................................... 0.1 # #<br />
‡Reporting standards not met. Too few cases for a reliable estim<strong>at</strong>e.<br />
#Rounds to zero.<br />
SOURCE: U.S. Department <strong>of</strong> Educ<strong>at</strong>ion, N<strong>at</strong>ional Center for Educ<strong>at</strong>ion St<strong>at</strong>istics, <strong>Postsecondary</strong> Educ<strong>at</strong>ion Quick Inform<strong>at</strong>ion System<br />
(PEQIS), “<strong>Dual</strong> <strong>Enrollment</strong> Programs and Courses for <strong>High</strong> <strong>School</strong> <strong>Students</strong>,” PEQIS 14, 2004.<br />
37
Table 9.<br />
Percentage distribution <strong>of</strong> Title IV degree-granting institutions with dual enrollment<br />
programs indic<strong>at</strong>ing when high school students were generally awarded college credit<br />
for courses taken, by institution type and size: 12-month academic year, 2002–03<br />
Institution type and size<br />
Immedi<strong>at</strong>ely after<br />
course completion<br />
Upon enrolling<br />
<strong>at</strong> institution<br />
Other<br />
All institutions.................................. 94 3 3<br />
Institution type 1<br />
Public 2-year ...................................... 92 4 4<br />
Public 4-year ...................................... 97 2 ‡<br />
Priv<strong>at</strong>e 4-year..................................... 96 ‡ 3<br />
Size <strong>of</strong> institution<br />
Less than 3,000 .................................. 93 3 4<br />
3,000 to 9,999 .................................... 93 4 3<br />
10,000 or more ................................... 98 ‡ 1<br />
‡Reporting standards not met. Too few cases for a reliable estim<strong>at</strong>e.<br />
1 D<strong>at</strong>a for priv<strong>at</strong>e 2-year institutions are not reported in a separ<strong>at</strong>e c<strong>at</strong>egory because too few priv<strong>at</strong>e 2-year institutions in the sample had any dual<br />
enrollment <strong>of</strong> high school students in 2002–03 to make reliable estim<strong>at</strong>es. D<strong>at</strong>a for priv<strong>at</strong>e 2-year institutions are included in the totals and in<br />
analyses by institution size.<br />
NOTE: Percentages are based on the 2,050 institutions with dual enrollment programs (see table 1). Detail may not sum to totals because <strong>of</strong><br />
rounding.<br />
SOURCE: U.S. Department <strong>of</strong> Educ<strong>at</strong>ion, N<strong>at</strong>ional Center for Educ<strong>at</strong>ion St<strong>at</strong>istics, <strong>Postsecondary</strong> Educ<strong>at</strong>ion Quick Inform<strong>at</strong>ion System<br />
(PEQIS), “<strong>Dual</strong> <strong>Enrollment</strong> Programs and Courses for <strong>High</strong> <strong>School</strong> <strong>Students</strong>,” PEQIS 14, 2004.<br />
38
Table 9-A.<br />
Standard errors <strong>of</strong> the percentage distribution <strong>of</strong> Title IV degree-granting institutions<br />
with dual enrollment programs indic<strong>at</strong>ing when high school students were generally<br />
awarded college credit for courses taken, by institution type and size: 12-month<br />
academic year, 2002–03<br />
Institution type and size<br />
Immedi<strong>at</strong>ely after<br />
course completion<br />
Upon enrolling<br />
<strong>at</strong> institution<br />
Other<br />
All institutions.................................. 0.8 0.7 0.7<br />
Institution type<br />
Public 2-year ...................................... 1.6 1.2 1.3<br />
Public 4-year ...................................... 1.6 1.1 ‡<br />
Priv<strong>at</strong>e 4-year..................................... 1.9 ‡ 1.8<br />
Size <strong>of</strong> institution<br />
Less than 3,000 .................................. 1.5 1.1 1.3<br />
3,000 to 9,999 .................................... 1.0 1.0 1.0<br />
10,000 or more ................................... # ‡ #<br />
‡Reporting standards not met. Too few cases for a reliable estim<strong>at</strong>e.<br />
# Rounds to zero.<br />
SOURCE: U.S. Department <strong>of</strong> Educ<strong>at</strong>ion, N<strong>at</strong>ional Center for Educ<strong>at</strong>ion St<strong>at</strong>istics, <strong>Postsecondary</strong> Educ<strong>at</strong>ion Quick Inform<strong>at</strong>ion System<br />
(PEQIS), “<strong>Dual</strong> <strong>Enrollment</strong> Programs and Courses for <strong>High</strong> <strong>School</strong> <strong>Students</strong>,” PEQIS 14, 2004.<br />
39
Table 10.<br />
Percentage distribution <strong>of</strong> Title IV degree-granting institutions with dual enrollment<br />
programs indic<strong>at</strong>ing the level <strong>at</strong> which credit was earned, by institution type and size:<br />
12-month academic year, 2002–03<br />
Institution type and size<br />
<strong>High</strong> school and<br />
college level College level only It varied 1 Don’t know 2<br />
All institutions.................................. 59 6 21 14<br />
Institution type 3<br />
Public 2-year ...................................... 66 3 22 9<br />
Public 4-year ...................................... 52 7 27 14<br />
Priv<strong>at</strong>e 4-year..................................... 53 10 13 25<br />
Size <strong>of</strong> institution<br />
Less than 3,000 .................................. 65 6 13 16<br />
3,000 to 9,999 .................................... 57 4 28 11<br />
10,000 or more ................................... 46 8 30 16<br />
1 The “it varied” response could indic<strong>at</strong>e th<strong>at</strong> credit was earned in various ways within a single program, or else th<strong>at</strong> credit was earned in different<br />
ways across multiple programs within an institution.<br />
2 Respondents answered “Don’t know” if they were not sure whether credits were earned <strong>at</strong> the high school level (in addition to the college level).<br />
3 D<strong>at</strong>a for priv<strong>at</strong>e 2-year institutions are not reported in a separ<strong>at</strong>e c<strong>at</strong>egory because too few priv<strong>at</strong>e 2-year institutions in the sample had any dual<br />
enrollment <strong>of</strong> high school students in 2002–03 to make reliable estim<strong>at</strong>es. D<strong>at</strong>a for priv<strong>at</strong>e 2-year institutions are included in the totals and in<br />
analyses by institution size.<br />
NOTE: Percentages are based on the 2,050 institutions with dual enrollment programs (see table 1). Detail may not sum to totals because <strong>of</strong><br />
rounding.<br />
SOURCE: U.S. Department <strong>of</strong> Educ<strong>at</strong>ion, N<strong>at</strong>ional Center for Educ<strong>at</strong>ion St<strong>at</strong>istics, <strong>Postsecondary</strong> Educ<strong>at</strong>ion Quick Inform<strong>at</strong>ion System<br />
(PEQIS), “<strong>Dual</strong> <strong>Enrollment</strong> Programs and Courses for <strong>High</strong> <strong>School</strong> <strong>Students</strong>,” PEQIS 14, 2004.<br />
40
Table 10-A.<br />
Standard errors <strong>of</strong> the percentage distribution <strong>of</strong> Title IV degree-granting<br />
institutions with dual enrollment programs indic<strong>at</strong>ing the level <strong>at</strong> which credit was<br />
earned, by institution type and size: 12-month academic year, 2002–03<br />
Institution type and size<br />
<strong>High</strong> school and<br />
college level College level only It varied Don’t know<br />
All institutions.................................. 2.1 0.9 1.6 1.4<br />
Institution type<br />
Public 2-year ...................................... 2.5 0.7 2.0 1.9<br />
Public 4-year ...................................... 3.0 1.2 2.5 1.6<br />
Priv<strong>at</strong>e 4-year..................................... 4.5 2.6 2.1 3.4<br />
Size <strong>of</strong> institution<br />
Less than 3,000 .................................. 3.6 1.6 2.4 2.5<br />
3,000 to 9,999 .................................... 2.9 1.1 2.8 1.6<br />
10,000 or more ................................... 0.2 0.0 0.1 0.1<br />
SOURCE: U.S. Department <strong>of</strong> Educ<strong>at</strong>ion, N<strong>at</strong>ional Center for Educ<strong>at</strong>ion St<strong>at</strong>istics, <strong>Postsecondary</strong> Educ<strong>at</strong>ion Quick Inform<strong>at</strong>ion System<br />
(PEQIS), “<strong>Dual</strong> <strong>Enrollment</strong> Programs and Courses for <strong>High</strong> <strong>School</strong> <strong>Students</strong>,” PEQIS 14, 2004.<br />
41
Table 11.<br />
Percent <strong>of</strong> Title IV degree-granting institutions with dual enrollment programs th<strong>at</strong><br />
had academic eligibility requirements for high school students to particip<strong>at</strong>e in the<br />
dual enrollment program and wh<strong>at</strong> those academic eligibility requirements were,<br />
by institution type and size: 12-month academic year, 2002–03<br />
<strong>Institutions</strong> with<br />
Academic eligibility requirements 2<br />
dual enrollment<br />
programs th<strong>at</strong> had<br />
Institution type<br />
academic<br />
and size<br />
eligibility<br />
requirements for<br />
Minimum score<br />
Passing a college<br />
Other academic<br />
high school<br />
Minimum high<br />
on a<br />
placement<br />
Minimum high<br />
eligibility<br />
students 1<br />
school GPA<br />
standardized test<br />
test<br />
school class rank<br />
requirement(s) 3<br />
All institutions... 85 66 45 44 16 31<br />
Institution type 4<br />
Public 2-year ....... 83 46 43 73 8 28<br />
Public 4-year ....... 93 79 60 22 28 36<br />
Priv<strong>at</strong>e 4-year...... 81 86 37 13 19 34<br />
Size <strong>of</strong> institution<br />
Less than 3,000 ... 83 66 43 43 17 29<br />
3,000 to 9,999 ..... 85 63 46 52 15 30<br />
10,000 or more .... 88 69 49 34 19 40<br />
1 Percentages are based on the 2,050 institutions with dual enrollment programs (see table 1).<br />
2 Percentages are based on the 1,730 institutions with academic eligibility requirements.<br />
3 Other eligibility requirements considered to be academic by some institutions included recommend<strong>at</strong>ions or permission (from the high school<br />
principal, guidance counselor, or a parent/guardian), course prerequisites, strong high school <strong>at</strong>tendance, junior or senior grade level, or essays or<br />
written letters.<br />
4 D<strong>at</strong>a for priv<strong>at</strong>e 2-year institutions are not reported in a separ<strong>at</strong>e c<strong>at</strong>egory because too few priv<strong>at</strong>e 2-year institutions in the sample had any dual<br />
enrollment <strong>of</strong> high school students in 2002–03 to make reliable estim<strong>at</strong>es. D<strong>at</strong>a for priv<strong>at</strong>e 2-year institutions are included in the totals and in<br />
analyses by institution size.<br />
SOURCE: U.S. Department <strong>of</strong> Educ<strong>at</strong>ion, N<strong>at</strong>ional Center for Educ<strong>at</strong>ion St<strong>at</strong>istics, <strong>Postsecondary</strong> Educ<strong>at</strong>ion Quick Inform<strong>at</strong>ion System<br />
(PEQIS), “<strong>Dual</strong> <strong>Enrollment</strong> Programs and Courses for <strong>High</strong> <strong>School</strong> <strong>Students</strong>,” PEQIS 14, 2004.<br />
42
Table 11-A.<br />
Standard errors <strong>of</strong> the percent <strong>of</strong> Title IV degree-granting institutions with dual<br />
enrollment programs th<strong>at</strong> had academic eligibility requirements for high school<br />
students to particip<strong>at</strong>e in the dual enrollment program and wh<strong>at</strong> those academic<br />
eligibility requirements were, by institution type and size: 12-month academic year,<br />
2002–03<br />
Institution type<br />
and size<br />
<strong>Institutions</strong> with<br />
dual enrollment<br />
programs th<strong>at</strong> had<br />
academic<br />
eligibility<br />
requirements for<br />
high school<br />
students<br />
Minimum high<br />
school GPA<br />
Academic eligibility requirements<br />
Minimum score Passing a college<br />
on a placement Minimum high<br />
standardized test<br />
test school class rank<br />
Other academic<br />
eligibility<br />
requirement(s)<br />
All institutions... 1.7 1.8 1.9 1.9 1.3 2.3<br />
Institution type 4<br />
Public 2-year ....... 2.3 3.0 2.7 2.8 1.7 3.3<br />
Public 4-year ....... 1.5 3.0 3.3 2.6 2.8 2.9<br />
Priv<strong>at</strong>e 4-year...... 4.0 3.7 3.9 3.4 3.4 4.0<br />
Size <strong>of</strong> institution<br />
Less than 3,000 ... 3.1 3.0 3.4 3.4 2.2 4.1<br />
3,000 to 9,999 ..... 1.9 2.3 2.5 2.6 2.0 3.2<br />
10,000 or more .... 0.1 0.3 0.4 0.4 0.2 0.1<br />
SOURCE: U.S. Department <strong>of</strong> Educ<strong>at</strong>ion, N<strong>at</strong>ional Center for Educ<strong>at</strong>ion St<strong>at</strong>istics, <strong>Postsecondary</strong> Educ<strong>at</strong>ion Quick Inform<strong>at</strong>ion System<br />
(PEQIS), “<strong>Dual</strong> <strong>Enrollment</strong> Programs and Courses for <strong>High</strong> <strong>School</strong> <strong>Students</strong>,” PEQIS 14, 2004.<br />
43
Table 12.<br />
Percent <strong>of</strong> Title IV degree-granting institutions with dual enrollment programs th<strong>at</strong><br />
had a minimum high school grade point average requirement to particip<strong>at</strong>e in the<br />
dual enrollment program, and the percentage distribution <strong>of</strong> the minimum GPA<br />
requirement, by institution type and size: 12-month academic year, 2002–03<br />
Institution type<br />
and size<br />
<strong>Institutions</strong><br />
with dual<br />
enrollment<br />
programs<br />
th<strong>at</strong> had a<br />
minimum<br />
high school<br />
GPA<br />
requirement 1<br />
Between<br />
1.75 and<br />
2.24<br />
Between<br />
2.25 and<br />
2.74<br />
Minimum GPA requirement 2<br />
Between Between<br />
2.75 and 3.25 and<br />
3.24<br />
3.74<br />
3.75 or<br />
above It varied 3<br />
All institutions.............. 66 7 10 44 22 3 14<br />
Institution type 4<br />
Public 2-year .................. 46 9 16 38 15 2 21<br />
Public 4-year .................. 79 5 7 46 27 4 12<br />
Priv<strong>at</strong>e 4-year................. 86 4 8 46 29 3 11<br />
Size <strong>of</strong> institution<br />
Less than 3,000 .............. 66 7 10 48 21 3 11<br />
3,000 to 9,999 ................ 63 7 11 41 19 3 18<br />
10,000 or more ............... 69 8 9 38 27 4 14<br />
1 Percentages are based on the 1,730 institutions with academic eligibility requirements.<br />
2 Percentages are based on the 1,140 institutions with a minimum GPA requirement.<br />
3 “It varied” could indic<strong>at</strong>e th<strong>at</strong> the minimum GPA varied within a single program, or else th<strong>at</strong> the minimum required GPA was different across<br />
multiple programs within an institution.<br />
4 D<strong>at</strong>a for priv<strong>at</strong>e 2-year institutions are not reported in a separ<strong>at</strong>e c<strong>at</strong>egory because too few priv<strong>at</strong>e 2-year institutions in the sample had any dual<br />
enrollment <strong>of</strong> high school students in 2002–03 to make reliable estim<strong>at</strong>es. D<strong>at</strong>a for priv<strong>at</strong>e 2-year institutions are included in the totals and in<br />
analyses by institution size.<br />
NOTE: Detail may not sum to totals because <strong>of</strong> rounding.<br />
SOURCE: U.S. Department <strong>of</strong> Educ<strong>at</strong>ion, N<strong>at</strong>ional Center for Educ<strong>at</strong>ion St<strong>at</strong>istics, <strong>Postsecondary</strong> Educ<strong>at</strong>ion Quick Inform<strong>at</strong>ion System<br />
(PEQIS), “<strong>Dual</strong> <strong>Enrollment</strong> Programs and Courses for <strong>High</strong> <strong>School</strong> <strong>Students</strong>,” PEQIS 14, 2004.<br />
44
Table 12-A.<br />
Standard errors <strong>of</strong> the percent <strong>of</strong> Title IV degree-granting institutions with dual<br />
enrollment programs th<strong>at</strong> had a minimum high school grade point average<br />
requirement to particip<strong>at</strong>e in the dual enrollment program, and the percentage<br />
distribution <strong>of</strong> the minimum GPA requirement, by institution type and size:<br />
12-month academic year, 2002–03<br />
Institution type<br />
and size<br />
<strong>Institutions</strong><br />
with dual<br />
enrollment<br />
programs<br />
th<strong>at</strong> had a<br />
minimum<br />
high school<br />
GPA<br />
requirement<br />
Between<br />
1.75 and<br />
2.24<br />
Between<br />
2.25 and<br />
2.74<br />
Minimum GPA requirement<br />
Between Between<br />
2.75 and 3.25 and<br />
3.24<br />
3.74<br />
3.75 or<br />
above<br />
It varied<br />
All institutions.............. 1.8 1.7 1.3 2.5 2.0 1.0 1.6<br />
Institution type<br />
Public 2-year .................. 3.0 2.3 2.8 4.2 3.4 1.0 3.0<br />
Public 4-year .................. 3.0 1.7 2.1 3.6 3.1 1.0 2.4<br />
Priv<strong>at</strong>e 4-year................. 3.7 2.7 2.5 4.6 4.0 1.0 3.0<br />
Size <strong>of</strong> institution<br />
Less than 3,000 .............. 3.0 3.1 2.1 4.5 3.4 1.9 2.5<br />
3,000 to 9,999 ................ 2.3 1.6 2.3 3.5 2.9 1.1 3.0<br />
10,000 or more ............... 0.3 0.2 0.1 0.2 0.2 0.1 0.1<br />
SOURCE: U.S. Department <strong>of</strong> Educ<strong>at</strong>ion, N<strong>at</strong>ional Center for Educ<strong>at</strong>ion St<strong>at</strong>istics, <strong>Postsecondary</strong> Educ<strong>at</strong>ion Quick Inform<strong>at</strong>ion System<br />
(PEQIS), “<strong>Dual</strong> <strong>Enrollment</strong> Programs and Courses for <strong>High</strong> <strong>School</strong> <strong>Students</strong>,” PEQIS 14, 2004.<br />
45
Table 13.<br />
Percent <strong>of</strong> Title IV degree-granting institutions with dual enrollment programs th<strong>at</strong><br />
had academic eligibility requirements for high school students to particip<strong>at</strong>e in the dual<br />
enrollment programs, and the percentage distribution <strong>of</strong> institutions indic<strong>at</strong>ing whether<br />
those requirements were the same or different than the institution’s admissions<br />
standards for regular college students, by institution type and size: 12-month academic<br />
year, 2002–03<br />
Institution type and size<br />
<strong>Institutions</strong> with dual<br />
enrollment programs th<strong>at</strong> had<br />
academic eligibility<br />
requirements for high school<br />
students 1<br />
Academic eligibility requirements were: 2<br />
The same as<br />
Different from<br />
admissions standards<br />
admissions standards<br />
for regular<br />
for regular<br />
college students<br />
college students<br />
All institutions......................................... 85 38 62<br />
Institution type 3<br />
Public 2-year ............................................. 83 55 45<br />
Public 4-year ............................................. 93 21 79<br />
Priv<strong>at</strong>e 4-year............................................ 82 27 73<br />
Size <strong>of</strong> institution<br />
Less than 3,000 ......................................... 83 38 62<br />
3,000 to 9,999 ........................................... 86 41 59<br />
10,000 or more .......................................... 88 34 66<br />
1 Percentages are based on the 2,050 institutions with dual enrollment programs (see table 1).<br />
2 Percentages are based on the 1,730 institutions with academic eligibility requirements.<br />
3 D<strong>at</strong>a for priv<strong>at</strong>e 2-year institutions are not reported in a separ<strong>at</strong>e c<strong>at</strong>egory because too few priv<strong>at</strong>e 2-year institutions in the sample had any dual<br />
enrollment <strong>of</strong> high school students in 2002–03 to make reliable estim<strong>at</strong>es. D<strong>at</strong>a for priv<strong>at</strong>e 2-year institutions are included in the totals and in<br />
analyses by institution size.<br />
NOTE: Detail may not sum to totals because <strong>of</strong> rounding.<br />
SOURCE: U.S. Department <strong>of</strong> Educ<strong>at</strong>ion, N<strong>at</strong>ional Center for Educ<strong>at</strong>ion St<strong>at</strong>istics, <strong>Postsecondary</strong> Educ<strong>at</strong>ion Quick Inform<strong>at</strong>ion System<br />
(PEQIS), “<strong>Dual</strong> <strong>Enrollment</strong> Programs and Courses for <strong>High</strong> <strong>School</strong> <strong>Students</strong>,” PEQIS 14, 2004.<br />
46
Table 13-A.<br />
Standard errors <strong>of</strong> the percent <strong>of</strong> Title IV degree-granting institutions with dual<br />
enrollment programs th<strong>at</strong> had academic eligibility requirements for high school<br />
students to particip<strong>at</strong>e in the dual enrollment programs, and the percentage<br />
distribution <strong>of</strong> institutions indic<strong>at</strong>ing whether those requirements were the same or<br />
different than the institution’s admissions standards for regular college students,<br />
by institution type and size: 12-month academic year, 2002–03<br />
Institution type and size<br />
<strong>Institutions</strong> with dual<br />
enrollment programs th<strong>at</strong> had<br />
academic eligibility<br />
requirements for high school<br />
students<br />
Academic eligibility requirements were:<br />
The same as<br />
Different from<br />
admissions standards<br />
admissions standards<br />
for regular<br />
for regular<br />
college students<br />
college students<br />
All institutions......................................... 1.7 2.0 2.0<br />
Institution type<br />
Public 2-year ............................................. 2.3 2.9 2.9<br />
Public 4-year ............................................. 1.5 2.4 2.4<br />
Priv<strong>at</strong>e 4-year............................................ 4.0 4.8 4.8<br />
Size <strong>of</strong> institution<br />
Less than 3,000 ......................................... 3.1 3.6 3.6<br />
3,000 to 9,999 ........................................... 1.9 2.7 2.7<br />
10,000 or more .......................................... 0.1 0.3 0.3<br />
SOURCE: U.S. Department <strong>of</strong> Educ<strong>at</strong>ion, N<strong>at</strong>ional Center for Educ<strong>at</strong>ion St<strong>at</strong>istics, <strong>Postsecondary</strong> Educ<strong>at</strong>ion Quick Inform<strong>at</strong>ion System<br />
(PEQIS), “<strong>Dual</strong> <strong>Enrollment</strong> Programs and Courses for <strong>High</strong> <strong>School</strong> <strong>Students</strong>,” PEQIS 14, 2004.<br />
47
Table 14.<br />
Percent <strong>of</strong> Title IV degree-granting institutions with dual enrollment programs<br />
indic<strong>at</strong>ing the grade levels <strong>of</strong> students eligible for the dual enrollment programs,<br />
by institution type and size: 12-month academic year, 2002–03<br />
Institution type and size Less than grade 9 Grade 9 Grade 10 Grade 11 Grade 12<br />
All institutions............................. 2 16 28 86 96<br />
Institution type 1<br />
Public 2-year ................................. 2 21 35 93 96<br />
Public 4-year ................................. 2 15 26 89 97<br />
Priv<strong>at</strong>e 4-year................................ ‡ 12 18 76 97<br />
Size <strong>of</strong> institution<br />
Less than 3,000 ............................. ‡ 14 23 83 96<br />
3,000 to 9,999 ............................... 3 16 30 88 96<br />
10,000 or more .............................. 2 26 40 93 97<br />
‡Reporting standards not met. Too few cases for a reliable estim<strong>at</strong>e.<br />
1 D<strong>at</strong>a for priv<strong>at</strong>e 2-year institutions are not reported in a separ<strong>at</strong>e c<strong>at</strong>egory because too few priv<strong>at</strong>e 2-year institutions in the sample had any dual<br />
enrollment <strong>of</strong> high school students in 2002–03 to make reliable estim<strong>at</strong>es. D<strong>at</strong>a for priv<strong>at</strong>e 2-year institutions are included in the totals and in<br />
analyses by institution size.<br />
NOTE: Percentages are based on the 2,050 institutions with dual enrollment programs (see table 1).<br />
SOURCE: U.S. Department <strong>of</strong> Educ<strong>at</strong>ion, N<strong>at</strong>ional Center for Educ<strong>at</strong>ion St<strong>at</strong>istics, <strong>Postsecondary</strong> Educ<strong>at</strong>ion Quick Inform<strong>at</strong>ion System<br />
(PEQIS), “<strong>Dual</strong> <strong>Enrollment</strong> Programs and Courses for <strong>High</strong> <strong>School</strong> <strong>Students</strong>,” PEQIS 14, 2004.<br />
48
Table 14-A.<br />
Standard errors <strong>of</strong> the percent <strong>of</strong> Title IV degree-granting institutions with dual<br />
enrollment programs indic<strong>at</strong>ing the grade levels <strong>of</strong> students for the dual enrollment<br />
programs, by institution type and size: 12-month academic year, 2002–03<br />
Institution type and size Less than grade 9 Grade 9 Grade 10 Grade 11 Grade 12<br />
All institutions............................. 0.4 1.5 2.0 1.8 0.8<br />
Institution type<br />
Public 2-year ................................. 0.6 1.9 2.5 1.6 1.3<br />
Public 4-year ................................. 1.2 1.9 2.4 1.2 0.7<br />
Priv<strong>at</strong>e 4-year................................ ‡ 2.8 3.4 4.3 1.4<br />
Size <strong>of</strong> institution<br />
Less than 3,000 ............................. ‡ 2.6 3.5 3.4 1.2<br />
3,000 to 9,999 ............................... 0.9 1.4 2.4 1.5 1.3<br />
10,000 or more .............................. # 0.2 0.3 0.1 #<br />
‡Reporting standards not met. Too few cases for a reliable estim<strong>at</strong>e.<br />
# Rounds to zero.<br />
SOURCE: U.S. Department <strong>of</strong> Educ<strong>at</strong>ion, N<strong>at</strong>ional Center for Educ<strong>at</strong>ion St<strong>at</strong>istics, <strong>Postsecondary</strong> Educ<strong>at</strong>ion Quick Inform<strong>at</strong>ion System<br />
(PEQIS), “<strong>Dual</strong> <strong>Enrollment</strong> Programs and Courses for <strong>High</strong> <strong>School</strong> <strong>Students</strong>,” PEQIS 14, 2004.<br />
49
Table 15.<br />
Percent <strong>of</strong> Title IV degree-granting institutions with dual enrollment programs<br />
indic<strong>at</strong>ing which sources paid tuition for college-level courses taken in the dual<br />
enrollment programs, by institution type and size: 12-month academic year, 2002–03<br />
Institution type and size<br />
Parents/<br />
students<br />
<strong>Postsecondary</strong><br />
institution 1<br />
<strong>High</strong> schools/<br />
public school<br />
districts<br />
The st<strong>at</strong>e<br />
Some other<br />
source 2<br />
All institutions............................. 64 38 37 26 9<br />
Institution type 3<br />
Public 2-year ................................ 56 33 45 31 10<br />
Public 4-year ................................ 72 33 41 25 7<br />
Priv<strong>at</strong>e 4-year................................ 71 50 21 15 8<br />
Size <strong>of</strong> institution<br />
Less than 3,000 ............................. 63 37 35 25 11<br />
3,000 to 9,999 ............................... 67 36 42 24 7<br />
10,000 or more .............................. 60 46 29 31 8<br />
1 <strong>Postsecondary</strong> institution includes the institution’s contributions and/or tuition waivers.<br />
2 The most commonly cited other sources included various federal and county grants, as well as scholarships from local businesses and nonpr<strong>of</strong>it<br />
organiz<strong>at</strong>ions.<br />
3 D<strong>at</strong>a for priv<strong>at</strong>e 2-year institutions are not reported in a separ<strong>at</strong>e c<strong>at</strong>egory because too few priv<strong>at</strong>e 2-year institutions in the sample had any dual<br />
enrollment <strong>of</strong> high school students in 2002–03 to make reliable estim<strong>at</strong>es. D<strong>at</strong>a for priv<strong>at</strong>e 2-year institutions are included in the totals and in<br />
analyses by institution size.<br />
NOTE: Percentages are based on the 2,050 institutions with dual enrollment programs (see table 1). Percentages do not sum to 100 because<br />
tuition could be paid by multiple sources.<br />
SOURCE: U.S. Department <strong>of</strong> Educ<strong>at</strong>ion, N<strong>at</strong>ional Center for Educ<strong>at</strong>ion St<strong>at</strong>istics, <strong>Postsecondary</strong> Educ<strong>at</strong>ion Quick Inform<strong>at</strong>ion System<br />
(PEQIS), “<strong>Dual</strong> <strong>Enrollment</strong> Programs and Courses for <strong>High</strong> <strong>School</strong> <strong>Students</strong>,” PEQIS 14, 2004.<br />
50
Table 15-A.<br />
Standard errors <strong>of</strong> the percent <strong>of</strong> Title IV degree-granting institutions with dual<br />
enrollment programs indic<strong>at</strong>ing which sources paid tuition for college-level courses<br />
taken in the dual enrollment programs, by institution type and size: 12-month<br />
academic year, 2002–03<br />
<strong>High</strong> schools/<br />
Institution type and size<br />
Parents/<br />
<strong>Postsecondary</strong><br />
public school<br />
Some other<br />
students<br />
institution<br />
districts<br />
The st<strong>at</strong>e<br />
source<br />
All institutions............................. 2.0 2.1 1.4 1.9 1.2<br />
Institution type<br />
Public 2-year ................................ 3.4 2.7 2.7 2.6 2.0<br />
Public 4-year ................................ 3.0 2.8 3.7 2.6 1.2<br />
Priv<strong>at</strong>e 4-year................................ 3.1 4.1 3.1 2.4 2.3<br />
Size <strong>of</strong> institution<br />
Less than 3,000 ............................. 3.3 3.7 2.2 3.4 2.1<br />
3,000 to 9,999 ............................... 3.3 2.5 2.8 2.2 1.3<br />
10,000 or more .............................. 0.3 0.2 0.1 0.1 0.0<br />
SOURCE: U.S. Department <strong>of</strong> Educ<strong>at</strong>ion, N<strong>at</strong>ional Center for Educ<strong>at</strong>ion St<strong>at</strong>istics, <strong>Postsecondary</strong> Educ<strong>at</strong>ion Quick Inform<strong>at</strong>ion System<br />
(PEQIS), “<strong>Dual</strong> <strong>Enrollment</strong> Programs and Courses for <strong>High</strong> <strong>School</strong> <strong>Students</strong>,” PEQIS 14, 2004.<br />
51
Table 16.<br />
Percentage distribution <strong>of</strong> Title IV degree-granting institutions with dual enrollment<br />
programs indic<strong>at</strong>ing the type <strong>of</strong> payment generally made by parents and students for<br />
courses taken in the dual enrollment programs, by institution type and size: 12-month<br />
academic year, 2002–03<br />
Institution type and size<br />
Full tuition<br />
Partial tuition<br />
Books and/or<br />
fees only Nothing It varied 1<br />
All institutions............................. 20 20 23 19 19<br />
Institution type 2<br />
Public 2-year ................................ 20 10 25 22 23<br />
Public 4-year ................................ 28 17 19 18 17<br />
Priv<strong>at</strong>e 4-year................................ 13 38 18 15 16<br />
Size <strong>of</strong> institution<br />
Less than 3,000 ............................. 16 24 21 21 18<br />
3,000 to 9,999 ............................... 24 16 23 15 22<br />
10,000 or more .............................. 24 13 26 18 19<br />
1 “It varied” could indic<strong>at</strong>e th<strong>at</strong> the amount paid out <strong>of</strong> pocket by students and parents varied within a single program, or else th<strong>at</strong> the amount paid<br />
varied across multiple programs within an institution.<br />
2 D<strong>at</strong>a for priv<strong>at</strong>e 2-year institutions are not reported in a separ<strong>at</strong>e c<strong>at</strong>egory because too few priv<strong>at</strong>e 2-year institutions in the sample had any dual<br />
enrollment <strong>of</strong> high school students in 2002–03 to make reliable estim<strong>at</strong>es. D<strong>at</strong>a for priv<strong>at</strong>e 2-year institutions are included in the totals and in<br />
analyses by institution size.<br />
NOTE: Percentages are based on the 2,050 institutions with dual enrollment programs (see table 1). Detail may not sum to totals because <strong>of</strong><br />
rounding.<br />
SOURCE: U.S. Department <strong>of</strong> Educ<strong>at</strong>ion, N<strong>at</strong>ional Center for Educ<strong>at</strong>ion St<strong>at</strong>istics, <strong>Postsecondary</strong> Educ<strong>at</strong>ion Quick Inform<strong>at</strong>ion System<br />
(PEQIS), “<strong>Dual</strong> <strong>Enrollment</strong> Programs and Courses for <strong>High</strong> <strong>School</strong> <strong>Students</strong>,” PEQIS 14, 2004.<br />
52
Table 16-A.<br />
Standard errors <strong>of</strong> the percentage distribution <strong>of</strong> Title IV degree-granting<br />
institutions with dual enrollment programs indic<strong>at</strong>ing the type <strong>of</strong> payment generally<br />
made by parents and students for courses taken in the dual enrollment programs,<br />
by institution type and size: 12-month academic year, 2002–03<br />
Institution type and size<br />
Full tuition<br />
Partial tuition<br />
Books and/or<br />
fees only Nothing It varied<br />
All institutions............................. 1.6 1.2 1.6 1.6 1.7<br />
Institution type<br />
Public 2-year ................................ 2.0 2.0 2.4 3.0 2.6<br />
Public 4-year ................................ 2.8 1.8 2.5 2.5 2.3<br />
Priv<strong>at</strong>e 4-year................................ 3.4 4.0 2.8 2.6 3.1<br />
Size <strong>of</strong> institution<br />
Less than 3,000 ............................. 2.8 2.0 2.7 2.8 2.9<br />
3,000 to 9,999 ............................... 2.3 1.7 2.3 2.0 2.4<br />
10,000 or more .............................. 0.1 0.1 0.2 0.1 0.1<br />
SOURCE: U.S. Department <strong>of</strong> Educ<strong>at</strong>ion, N<strong>at</strong>ional Center for Educ<strong>at</strong>ion St<strong>at</strong>istics, <strong>Postsecondary</strong> Educ<strong>at</strong>ion Quick Inform<strong>at</strong>ion System<br />
(PEQIS), “<strong>Dual</strong> <strong>Enrollment</strong> Programs and Courses for <strong>High</strong> <strong>School</strong> <strong>Students</strong>,” PEQIS 14, 2004.<br />
53
Table 17.<br />
Number and percent <strong>of</strong> Title IV degree-granting institutions with dual enrollment<br />
programs geared specifically toward high school students <strong>at</strong> risk <strong>of</strong> educ<strong>at</strong>ion failure,<br />
by institution type and size: 12-month academic year, 2002–03<br />
Institution type and size<br />
Number <strong>of</strong> institutions<br />
Percent based on<br />
all institutions 1<br />
Percent based on<br />
institutions with dual<br />
enrollment programs 2<br />
All institutions............................................. 110 2 5<br />
Institution type<br />
Public 2-year ................................................. 90 8 9<br />
Priv<strong>at</strong>e 2-year................................................ ‡ ‡ ‡<br />
Public 4-year ................................................. 10 2 2<br />
Priv<strong>at</strong>e 4-year................................................ ‡ ‡ ‡<br />
Size <strong>of</strong> institution<br />
Less than 3,000 ............................................. 40 1 4<br />
3,000 to 9,999 ............................................... 40 4 5<br />
10,000 or more .............................................. 30 7 9<br />
‡Reporting standards not met. Too few cases for a reliable estim<strong>at</strong>e.<br />
1 Percentages are based on the 4,240 Title IV degree-granting institutions in the n<strong>at</strong>ion.<br />
2 Percentages are based on the 2,050 institutions th<strong>at</strong> had dual enrollment programs (see table 1).<br />
NOTE: Detail may not sum to totals because <strong>of</strong> rounding.<br />
SOURCE: U.S. Department <strong>of</strong> Educ<strong>at</strong>ion, N<strong>at</strong>ional Center for Educ<strong>at</strong>ion St<strong>at</strong>istics, <strong>Postsecondary</strong> Educ<strong>at</strong>ion Quick Inform<strong>at</strong>ion System<br />
(PEQIS), “<strong>Dual</strong> <strong>Enrollment</strong> Programs and Courses for <strong>High</strong> <strong>School</strong> <strong>Students</strong>,” PEQIS 14, 2004.<br />
54
Table 17-A.<br />
Standard errors <strong>of</strong> the number and percent <strong>of</strong> Title IV degree-granting institutions<br />
with dual enrollment programs geared specifically toward high school students <strong>at</strong><br />
risk <strong>of</strong> educ<strong>at</strong>ional failure, by institution type and size: 12-month academic year,<br />
2002–03<br />
Institution type and size<br />
Number <strong>of</strong> institutions<br />
Percent based on<br />
all institutions<br />
Percent based on<br />
institutions with dual<br />
enrollment programs<br />
All institutions........................................... 17.5 0.4 0.9<br />
Institution type<br />
Public 2-year ............................................... 16.7 1.5 1.7<br />
Priv<strong>at</strong>e 2-year.............................................. ‡ ‡ ‡<br />
Public 4-year ............................................... 2.8 0.5 0.7<br />
Priv<strong>at</strong>e 4-year.............................................. ‡ ‡ ‡<br />
Size <strong>of</strong> institution<br />
Less than 3,000 ........................................... 15.6 0.5 1.5<br />
3,000 to 9,999 ............................................. 7.7 0.9 1.2<br />
10,000 or more ............................................ 0.9 0.1 0.1<br />
‡Reporting standard not met. Too few cases for a reliable estim<strong>at</strong>e.<br />
SOURCE: U.S. Department <strong>of</strong> Educ<strong>at</strong>ion, N<strong>at</strong>ional Center for Educ<strong>at</strong>ion St<strong>at</strong>istics, <strong>Postsecondary</strong> Educ<strong>at</strong>ion Quick Inform<strong>at</strong>ion System<br />
(PEQIS), “<strong>Dual</strong> <strong>Enrollment</strong> Programs and Courses for <strong>High</strong> <strong>School</strong> <strong>Students</strong>,” PEQIS 14, 2004.<br />
55
Table 18. Standard errors for figures: 12-month academic year, 2002–03<br />
Item Estim<strong>at</strong>e Standard error<br />
Figure 1. Percentage distribution <strong>of</strong> Title IV degree-granting institutions with any high<br />
school students taking courses for college credit, by whether courses were taken within<br />
dual enrollment programs only, outside <strong>of</strong> dual enrollment programs only, or both within<br />
and outside <strong>of</strong> programs: 12-month academic year, 2002–03<br />
Within programs only..................................................................................................................... 45 2.3<br />
Outside <strong>of</strong> programs only ............................................................................................................... 15 1.2<br />
Both within and outside <strong>of</strong> programs.............................................................................................. 40 1.9<br />
Figure 2. Percentage distribution <strong>of</strong> high school students taking courses for college credit<br />
within or outside <strong>of</strong> dual enrollment programs: 12-month academic year, 2002–03<br />
<strong>High</strong> school students taking courses within dual enrollment programs........................................... 84 1.3<br />
<strong>High</strong> school students taking college courses outside <strong>of</strong> dual enrollment programs......................... 16 1.3<br />
Figure 3. Percentage distribution <strong>of</strong> high school students taking courses for college credit,<br />
by institution type: 12-month academic year, 2002–03<br />
<strong>High</strong> school students taking college courses <strong>at</strong> public 2-year institutions....................................... 77 1.6<br />
<strong>High</strong> school students taking college courses <strong>at</strong> public 4-year institutions....................................... 15 1.2<br />
<strong>High</strong> school students taking college courses <strong>at</strong> priv<strong>at</strong>e 4-year institutions...................................... 8 1.0<br />
Figure 4. Percentage distribution <strong>of</strong> Title IV degree-granting institutions with dual<br />
enrollment programs for <strong>at</strong>-risk high school students, by primary focus <strong>of</strong> such<br />
programs: 12-month academic year, 2002–03<br />
Career/technical focus .................................................................................................................... 39 8.8<br />
Academic focus.............................................................................................................................. 34 5.5<br />
Equally academic and career/technical focus ................................................................................. 21 8.6<br />
Other focus..................................................................................................................................... 6 2.5<br />
Figure 5. Percentage distribution <strong>of</strong> Title IV degree-granting institutions with dual<br />
enrollment programs for <strong>at</strong>-risk high school students, by typical p<strong>at</strong>terns <strong>of</strong> enrollments<br />
in such programs: 12-month academic year, 2002–03<br />
One course per academic term........................................................................................................ 40 9.0<br />
Two courses per academic term...................................................................................................... 14 4.1<br />
Three or more courses per academic term ...................................................................................... 8 2.5<br />
Number <strong>of</strong> courses varied considerably.......................................................................................... 38 8.9<br />
Figure 6. Percent <strong>of</strong> Title IV degree-granting institutions with dual enrollment programs<br />
for <strong>at</strong>-risk high school students th<strong>at</strong> had extra support services, by specific extra<br />
support services: 12-month academic year, 2002–03<br />
Academic advising ......................................................................................................................... 84 6.6<br />
Tutoring.......................................................................................................................................... 82 5.3<br />
Study skills workshops................................................................................................................... 76 7.1<br />
College applic<strong>at</strong>ion/selection counseling........................................................................................ 75 6.3<br />
Financial aid counseling ................................................................................................................. 62 8.0<br />
Other support services .................................................................................................................... 38 7.6<br />
SOURCE: U.S. Department <strong>of</strong> Educ<strong>at</strong>ion, N<strong>at</strong>ional Center for Educ<strong>at</strong>ion St<strong>at</strong>istics, <strong>Postsecondary</strong> Educ<strong>at</strong>ion Quick Inform<strong>at</strong>ion System<br />
(PEQIS), “<strong>Dual</strong> <strong>Enrollment</strong> Programs and Courses for <strong>High</strong> <strong>School</strong> <strong>Students</strong>,” PEQIS 14, 2004.<br />
56
Appendix A<br />
Technical Notes<br />
A-1
This page intentionally left blank.<br />
A-2
Technical Notes<br />
<strong>Postsecondary</strong> Educ<strong>at</strong>ion Quick Inform<strong>at</strong>ion System<br />
The <strong>Postsecondary</strong> Educ<strong>at</strong>ion Quick Inform<strong>at</strong>ion System (PEQIS) was established in 1991<br />
by the N<strong>at</strong>ional Center for Educ<strong>at</strong>ion St<strong>at</strong>istics (NCES), U.S. Department <strong>of</strong> Educ<strong>at</strong>ion (ED). PEQIS is<br />
designed to conduct brief surveys <strong>of</strong> postsecondary institutions or st<strong>at</strong>e higher educ<strong>at</strong>ion agencies on<br />
postsecondary educ<strong>at</strong>ion topics <strong>of</strong> n<strong>at</strong>ional importance. Surveys are generally limited to three pages <strong>of</strong><br />
questions, with a response burden <strong>of</strong> about 30 minutes per respondent. Most PEQIS institutional surveys<br />
use a previously recruited, n<strong>at</strong>ionally represent<strong>at</strong>ive panel <strong>of</strong> institutions. The PEQIS panel was originally<br />
selected and recruited in 1991–92. In 1996, the PEQIS panel was reselected to reflect changes in the<br />
postsecondary educ<strong>at</strong>ion universe th<strong>at</strong> had occurred since the original panel was selected. A modified<br />
Keyfitz approach was used to maximize overlap between the panels; this resulted in 80 percent <strong>of</strong> the<br />
institutions in the 1996 panel overlapping with the 1991–92 panel. The PEQIS panel was reselected again<br />
in 2002. A modified Keyfitz approach was used to maximize the overlap between the 1996 and 2002<br />
samples; 81 percent <strong>of</strong> the institutions overlapped between these two panels.<br />
At the time the 1991–92 and 1996 PEQIS panels were selected, NCES was defining higher<br />
educ<strong>at</strong>ion institutions as institutions accredited <strong>at</strong> the college level by an agency recognized by the<br />
Secretary <strong>of</strong> the U.S. Department <strong>of</strong> Educ<strong>at</strong>ion. However, ED no longer makes a distinction between<br />
higher educ<strong>at</strong>ion institutions and other postsecondary institutions th<strong>at</strong> are eligible to particip<strong>at</strong>e in federal<br />
financial aid programs. Thus, NCES no longer c<strong>at</strong>egorizes institutions as higher educ<strong>at</strong>ion institutions.<br />
Instead, NCES now c<strong>at</strong>egorizes institutions on the basis <strong>of</strong> whether the institution is eligible to award<br />
federal Title IV financial aid, and whether the institution grants degrees <strong>at</strong> the associ<strong>at</strong>e’s level or higher.<br />
<strong>Institutions</strong> th<strong>at</strong> are both Title IV-eligible and degree-granting are approxim<strong>at</strong>ely equivalent to higher<br />
educ<strong>at</strong>ion institutions as previously defined. It is this subset <strong>of</strong> postsecondary institutions (Title IVeligible<br />
and degree-granting) th<strong>at</strong> are included in the 2002 PEQIS sampling frame.<br />
The sampling frame for the 2002 PEQIS panel was constructed from the 2000 Integr<strong>at</strong>ed<br />
<strong>Postsecondary</strong> Educ<strong>at</strong>ion D<strong>at</strong>a System (IPEDS) Institutional Characteristics file. <strong>Institutions</strong> eligible for<br />
the 2002 PEQIS frame included 2-year and 4-year (including gradu<strong>at</strong>e-level) institutions th<strong>at</strong> are both<br />
Title IV eligible and degree granting, and are loc<strong>at</strong>ed in the 50 st<strong>at</strong>es and the District <strong>of</strong> Columbia: a total<br />
<strong>of</strong> 4,175 institutions. The 2002 PEQIS sampling frame was str<strong>at</strong>ified by instructional level (4-year, 2-<br />
year), control (public, priv<strong>at</strong>e nonpr<strong>of</strong>it, priv<strong>at</strong>e for-pr<strong>of</strong>it), highest level <strong>of</strong> <strong>of</strong>fering (doctor’s/firstpr<strong>of</strong>essional,<br />
master’s, bachelor’s, less than bachelor’s), and total enrollment. Within each <strong>of</strong> the str<strong>at</strong>a,<br />
A-3
institutions were sorted by region (Northeast, Southeast, Central, West) and by whether the institution had<br />
a rel<strong>at</strong>ively high minority enrollment. The sample <strong>of</strong> 1,610 institutions was alloc<strong>at</strong>ed to the str<strong>at</strong>a in<br />
proportion to the aggreg<strong>at</strong>e square root <strong>of</strong> total enrollment. <strong>Institutions</strong> within a str<strong>at</strong>um were sampled<br />
with equal probabilities <strong>of</strong> selection. The modified Keyfitz approach resulted in 81 percent <strong>of</strong> the<br />
institutions in the 2002 panel overlapping with the 1996 panel. Panel recruitment was conducted with the<br />
300 institutions th<strong>at</strong> were not part <strong>of</strong> the overlap sample. During panel recruitment, 6 institutions were<br />
found to be ineligible for PEQIS. The final unweighted response r<strong>at</strong>e <strong>at</strong> the end <strong>of</strong> PEQIS panel<br />
recruitment with the institutions th<strong>at</strong> were not part <strong>of</strong> the overlap sample was 97 percent (285 <strong>of</strong> the 294<br />
eligible institutions). There were 1,600 eligible institutions in the entire 2002 panel, because 4<br />
institutions in the overlap sample were determined to be ineligible for various reasons. The final<br />
unweighted particip<strong>at</strong>ion r<strong>at</strong>e across the institutions th<strong>at</strong> were selected for the 2002 panel was 99 percent<br />
(1,591 particip<strong>at</strong>ing institutions out <strong>of</strong> 1,600 eligible institutions). The weighted panel particip<strong>at</strong>ion r<strong>at</strong>e<br />
was also 99 percent.<br />
Each institution in the PEQIS panel was asked to identify a campus represent<strong>at</strong>ive to serve as<br />
survey coordin<strong>at</strong>or. The campus represent<strong>at</strong>ive facilit<strong>at</strong>es d<strong>at</strong>a collection by identifying the appropri<strong>at</strong>e<br />
respondent for each survey and forwarding the questionnaire to th<strong>at</strong> person. D<strong>at</strong>a are weighted to produce<br />
n<strong>at</strong>ional estim<strong>at</strong>es, and the sample size allows for limited breakouts by classific<strong>at</strong>ion variables. However,<br />
as the number <strong>of</strong> c<strong>at</strong>egories within the classific<strong>at</strong>ion variables increases, the sample size within c<strong>at</strong>egories<br />
decreases, which results in larger sampling errors for the breakouts by classific<strong>at</strong>ion variables.<br />
Sample Selection and Response R<strong>at</strong>es<br />
The sample for the survey consisted <strong>of</strong> all <strong>of</strong> the institutions in the 2002 PEQIS panel. In<br />
February 2004, questionnaires (see appendix B) were mailed to the PEQIS coordin<strong>at</strong>ors <strong>at</strong> the institutions.<br />
Coordin<strong>at</strong>ors were told th<strong>at</strong> the survey was designed to be completed by the person <strong>at</strong> the institution most<br />
knowledgeable about the institution’s dual enrollment programs and courses. Respondents had the option<br />
<strong>of</strong> completing the survey online. Telephone follow-up <strong>of</strong> nonrespondents was initi<strong>at</strong>ed in mid-March<br />
2004; d<strong>at</strong>a collection and clarific<strong>at</strong>ion were completed in June 2004. Before and during d<strong>at</strong>a collection for<br />
the PEQIS dual enrollment survey, 23 institutions were determined to be ineligible for the panel. For the<br />
eligible institutions, an unweighted response r<strong>at</strong>e <strong>of</strong> 92 percent (1,461 responding institutions divided by<br />
the 1,587 eligible institutions in the sample for this survey) was obtained. The weighted response r<strong>at</strong>e for<br />
this survey was 93 percent. The unweighted overall response r<strong>at</strong>e was 91 percent (99.4 percent panel<br />
particip<strong>at</strong>ion r<strong>at</strong>e multiplied by the 92 percent survey response r<strong>at</strong>e). The weighted overall response r<strong>at</strong>e<br />
was 92 percent (99.3 percent weighted panel particip<strong>at</strong>ion r<strong>at</strong>e multiplied by the 93 percent weighted<br />
A-4
survey response r<strong>at</strong>e). Of the institutions th<strong>at</strong> completed the survey, 51 percent completed it online, 32<br />
percent completed it by mail, 9 percent completed it by fax, and 8 percent completed it by telephone.<br />
Following d<strong>at</strong>a collection on the PEQIS 2004 dual enrollment survey, a poststr<strong>at</strong>ific<strong>at</strong>ion weighting<br />
adjustment was made to the totals in the 2002 IPEDS Institutional Characteristics file. The weighted<br />
number <strong>of</strong> eligible institutions in the survey represent the estim<strong>at</strong>ed universe <strong>of</strong> approxim<strong>at</strong>ely 4,240 Title<br />
IV-eligible degree-granting institutions in the 50 st<strong>at</strong>es and the District <strong>of</strong> Columbia (see table A-1).<br />
Table A-1.<br />
Number and percent <strong>of</strong> Title IV degree-granting institutions in the study, and the<br />
estim<strong>at</strong>ed number and percent in the n<strong>at</strong>ion, for the total sample and for institutions<br />
th<strong>at</strong> had any dual enrollment, by institution type and size: 2004<br />
Institution type and size<br />
Had any dual enrollment during the 2002–03<br />
Total sample<br />
12-month academic year<br />
Responding<br />
Responding<br />
institutions<br />
(unweighted)<br />
N<strong>at</strong>ional estim<strong>at</strong>e<br />
(weighted)<br />
institutions<br />
(unweighted)<br />
N<strong>at</strong>ional estim<strong>at</strong>e<br />
(weighted)<br />
Number Percent Number Percent Number Percent Number Percent<br />
All institutions............................................ 1,461 100 4,240 100 1,085 100 2,410 100<br />
Institution type<br />
Public 2-year ................................................ 491 34 1,090 26 487 45 1,070 44<br />
Priv<strong>at</strong>e 2-year ............................................... 85 6 660 16 15 1 110 5<br />
Public 4-year ................................................ 392 27 630 15 326 30 490 20<br />
Priv<strong>at</strong>e 4-year ............................................... 493 34 1,860 44 257 24 750 31<br />
Size <strong>of</strong> institution<br />
Less than 3,000............................................. 580 40 2,940 69 304 28 1,290 53<br />
3,000 to 9,999............................................... 489 33 870 21 413 38 730 30<br />
10,000 or more ............................................. 392 27 420 10 368 34 400 16<br />
NOTE: Detail may not sum to totals because <strong>of</strong> rounding.<br />
SOURCE: U.S. Department <strong>of</strong> Educ<strong>at</strong>ion, N<strong>at</strong>ional Center for Educ<strong>at</strong>ion St<strong>at</strong>istics, <strong>Postsecondary</strong> Educ<strong>at</strong>ion Quick Inform<strong>at</strong>ion System<br />
(PEQIS), “<strong>Dual</strong> <strong>Enrollment</strong> Programs and Courses for <strong>High</strong> <strong>School</strong> <strong>Students</strong>,” PEQIS 14, 2004.<br />
Imput<strong>at</strong>ion for Item Nonresponse<br />
Weighted item nonresponse r<strong>at</strong>es ranged from 0 to 2 percent for all items. Although item<br />
nonresponse for key items was very low, d<strong>at</strong>a were imputed for all missing questionnaire d<strong>at</strong>a. These 20<br />
items are listed in table A-2. The missing items included both numerical d<strong>at</strong>a such as counts <strong>of</strong> students<br />
in dual enrollment programs or outside <strong>of</strong> programs, as well as c<strong>at</strong>egorical d<strong>at</strong>a such as which sources<br />
paid tuition for courses taken by high school students in dual enrollment programs. The missing d<strong>at</strong>a<br />
were imputed using a “hot-deck” approach to obtain a “donor” institution from which the imputed values<br />
were derived. Under the hot-deck approach, a donor institution th<strong>at</strong> m<strong>at</strong>ched selected characteristics <strong>of</strong><br />
A-5
the institution with missing d<strong>at</strong>a (the recipient institution) was identified. The m<strong>at</strong>ching characteristics<br />
included PEQIS str<strong>at</strong>um (defined by sector, highest level <strong>of</strong> <strong>of</strong>fering, and enrollment size) and whether<br />
the institution <strong>of</strong>fered courses inside or outside <strong>of</strong> a dual enrollment program. Once a donor was found, it<br />
was used to derive the imputed values for the institution with missing d<strong>at</strong>a. For c<strong>at</strong>egorical items, the<br />
imputed value was simply the corresponding value from the donor institution. For numerical items, the<br />
imputed value was calcul<strong>at</strong>ed by taking the donor’s response for th<strong>at</strong> item (e.g., enrollment in dual<br />
enrollment programs) and dividing th<strong>at</strong> number by the total number <strong>of</strong> students enrolled in the donor<br />
institution. This r<strong>at</strong>io was then multiplied by the total number <strong>of</strong> students enrolled in the recipient<br />
institution to provide an imputed value. All missing items for a given institution were imputed from the<br />
same donor whenever possible.<br />
Table A-2. Number <strong>of</strong> cases with imputed d<strong>at</strong>a in the study sample, and number <strong>of</strong> cases with<br />
imputed d<strong>at</strong>a the sample represents, by questionnaire items: 2004<br />
Questionnaire item<br />
Responding<br />
institutions<br />
(unweighted)<br />
N<strong>at</strong>ional<br />
estim<strong>at</strong>e<br />
(weighted)<br />
3. How many high school students took courses outside <strong>of</strong> any dual enrollment program?................................ 35 50<br />
5. How many high school students took courses th<strong>at</strong> were part <strong>of</strong> a dual enrollment program?................................ 8 14<br />
9. How did the qualific<strong>at</strong>ions for high school instructors compare to those for college instructors?................................1 1<br />
10. Which <strong>of</strong> the following most closely resembles the typical p<strong>at</strong>tern <strong>of</strong> high school enrollments?................................ 2 3<br />
12. When were high school students generally awarded college credit for courses taken? ................................ 2 2<br />
13. Were there academic eligibility requirements for high school students?................................................................ 1 1<br />
14A. Was minimum high school grade point average an academic eligibility requirement? ................................ 1 2<br />
14B. Was minimum score on a standardized test, such as the SAT an academic eligibility requirement?.............................. 1 2<br />
14C. Was minimum high school class rank an academic eligibility requirement?................................................................2 3<br />
14D. Was passing a college placement test given by your institution an academic eligibility requirement?........................... 2 3<br />
14E. Were there some other academic eligibility requirement(s)? ......................................................................................... 1 2<br />
15. Wh<strong>at</strong> was the minimum high school GPA (on a 4-point scale) required for the dual enrollment<br />
program?................................................................................................................................................................ 2 5<br />
16. Were academic requirements for high school students the same or different than for regular college<br />
18.<br />
students? ................................................................................................................................................................ 1 2<br />
Was the curriculum specifically designed for high school students or the same as for regular<br />
students? ................................................................................................................................................................ 3 4<br />
19B. Which sources paid tuition for courses taken? The st<strong>at</strong>e................................................................................................ 1 3<br />
19C. Which sources paid tuition for courses taken? <strong>High</strong> schools/public school districts ................................ 1 3<br />
19D. Which sources paid tuition for courses taken? Parents/students................................................................ 1 3<br />
19E. Which sources paid tuition for courses taken? Some other source(s)................................................................ 2 4<br />
20. Wh<strong>at</strong> did high school students (and their parents) generally pay out <strong>of</strong> pocket for courses?................................ 5 13<br />
22. How many <strong>at</strong>-risk high school students were enrolled in the program? ................................................................ 1 1<br />
SOURCE: U.S. Department <strong>of</strong> Educ<strong>at</strong>ion, N<strong>at</strong>ional Center for Educ<strong>at</strong>ion St<strong>at</strong>istics, <strong>Postsecondary</strong> Educ<strong>at</strong>ion Quick Inform<strong>at</strong>ion System<br />
(PEQIS), “<strong>Dual</strong> <strong>Enrollment</strong> Programs and Courses for <strong>High</strong> <strong>School</strong> <strong>Students</strong>,” PEQIS 14, 2004.<br />
A-6
D<strong>at</strong>a Reliability<br />
While the “<strong>Dual</strong> <strong>Enrollment</strong> Programs and Courses for <strong>High</strong> <strong>School</strong> <strong>Students</strong>” survey was<br />
designed to account for sampling error and to minimize nonsampling error, estim<strong>at</strong>es produced from the<br />
d<strong>at</strong>a collected are subject to both types <strong>of</strong> error. Sampling error occurs because the d<strong>at</strong>a are collected<br />
from a sample r<strong>at</strong>her than a census <strong>of</strong> the popul<strong>at</strong>ion, and nonsampling errors are errors made during the<br />
collection and processing <strong>of</strong> the d<strong>at</strong>a.<br />
Sampling Errors<br />
The responses were weighted to produce n<strong>at</strong>ional estim<strong>at</strong>es (see table A-1). The weights<br />
were designed to adjust for the variable probabilities <strong>of</strong> selection and differential nonresponse. The<br />
findings in this report are estim<strong>at</strong>es based on the sample selected and, consequently, are subject to<br />
sampling variability. General sampling theory was used to estim<strong>at</strong>e the sampling variability <strong>of</strong> the<br />
estim<strong>at</strong>es and to test for st<strong>at</strong>istically significant differences between estim<strong>at</strong>es.<br />
The standard error is a measure <strong>of</strong> the variability <strong>of</strong> an estim<strong>at</strong>e due to sampling. It indic<strong>at</strong>es<br />
the variability <strong>of</strong> a sample estim<strong>at</strong>e th<strong>at</strong> would be obtained from all possible samples <strong>of</strong> a given design<br />
and size. Standard errors are used as a measure <strong>of</strong> the precision expected from a particular sample. If all<br />
possible samples were surveyed under similar conditions, intervals <strong>of</strong> 1.96 standard errors below to 1.96<br />
standard errors above a particular st<strong>at</strong>istic would include the true popul<strong>at</strong>ion parameter being estim<strong>at</strong>ed in<br />
about 95 percent <strong>of</strong> the samples. This is a 95 percent confidence interval. For example, the estim<strong>at</strong>ed<br />
percentage <strong>of</strong> Title IV degree-granting institutions with any dual enrollment is 56.9 percent and the<br />
standard error is 1.1 percent (see tables 1 and 1a). The 95 percent confidence interval for the st<strong>at</strong>istic<br />
extends from [56.9 – (1.1 x 1.96)] to [56.9 + (1.1 x 1.96)], or from 54.7 to 59.1 percent. The 1.96 is the<br />
critical value for a st<strong>at</strong>istical test <strong>at</strong> the 0.05 significance level (where 0.05 indic<strong>at</strong>es the 5 percent <strong>of</strong> all<br />
possible samples th<strong>at</strong> would be outside the range <strong>of</strong> the confidence interval).<br />
Because the d<strong>at</strong>a from the PEQIS dual enrollment programs and courses survey were<br />
collected using a complex sampling design, the variances <strong>of</strong> the estim<strong>at</strong>es from this survey (e.g., estim<strong>at</strong>es<br />
<strong>of</strong> proportions) are typically different from wh<strong>at</strong> would be expected from d<strong>at</strong>a collected with a simple<br />
random sample. Not taking the complex sample design into account can lead to an underestim<strong>at</strong>ion <strong>of</strong> the<br />
standard errors associ<strong>at</strong>ed with such estim<strong>at</strong>es. To gener<strong>at</strong>e accur<strong>at</strong>e standard errors for the estim<strong>at</strong>es in<br />
this report, standard errors were computed using a technique known as jackknife replic<strong>at</strong>ion. As with any<br />
replic<strong>at</strong>ion method, jackknife replic<strong>at</strong>ion involves constructing a number <strong>of</strong> subsamples (replic<strong>at</strong>es) from<br />
A-7
the full sample and computing the st<strong>at</strong>istic <strong>of</strong> interest for each replic<strong>at</strong>e. The mean square error <strong>of</strong> the<br />
replic<strong>at</strong>e estim<strong>at</strong>es around the full sample estim<strong>at</strong>e provides an estim<strong>at</strong>e <strong>of</strong> the variance <strong>of</strong> the st<strong>at</strong>istic.<br />
To construct the replic<strong>at</strong>ions, 50 str<strong>at</strong>ified subsamples <strong>of</strong> the full sample were cre<strong>at</strong>ed and then dropped 1<br />
<strong>at</strong> a time to define 50 jackknife replic<strong>at</strong>es. A computer program (WesVar) was used to calcul<strong>at</strong>e the<br />
estim<strong>at</strong>es <strong>of</strong> standard errors. WesVar is a stand-alone Windows applic<strong>at</strong>ion th<strong>at</strong> computes sampling<br />
errors from complex samples for a wide variety <strong>of</strong> st<strong>at</strong>istics (totals, percents, r<strong>at</strong>ios, log-odds r<strong>at</strong>ios,<br />
general functions <strong>of</strong> estim<strong>at</strong>es in tables, linear regression parameters, and logistic regression parameters).<br />
Nonsampling Errors<br />
Nonsampling error is the term used to describe vari<strong>at</strong>ions in the estim<strong>at</strong>es th<strong>at</strong> may be caused<br />
by popul<strong>at</strong>ion coverage limit<strong>at</strong>ions and d<strong>at</strong>a collection, processing, and reporting procedures. The sources<br />
<strong>of</strong> nonsampling errors are typically problems like unit and item nonresponse, differences in respondents’<br />
interpret<strong>at</strong>ions <strong>of</strong> the meaning <strong>of</strong> questions, response differences rel<strong>at</strong>ed to the particular time the survey<br />
was conducted, and mistakes made during d<strong>at</strong>a prepar<strong>at</strong>ion. It is difficult to identify and estim<strong>at</strong>e either<br />
the amount <strong>of</strong> nonsampling error or the bias caused by this error. To minimize the potential for<br />
nonsampling error, this study used a variety <strong>of</strong> procedures, including a pretest <strong>of</strong> the questionnaire with<br />
individuals <strong>at</strong> postsecondary institutions deemed to be the most knowledgeable about the dual enrollment<br />
programs and courses <strong>at</strong> their institutions. The pretest provided the opportunity to check for consistency<br />
<strong>of</strong> interpret<strong>at</strong>ion <strong>of</strong> questions and definitions and to elimin<strong>at</strong>e ambiguous items. The questionnaire and<br />
instructions were also extensively reviewed by NCES and the d<strong>at</strong>a requestor <strong>at</strong> the Office <strong>of</strong> Voc<strong>at</strong>ional<br />
and Adult Educ<strong>at</strong>ion. In addition, manual and machine editing <strong>of</strong> the questionnaire responses were<br />
conducted to check the d<strong>at</strong>a for accuracy and consistency. Cases with missing or inconsistent items were<br />
recontacted by telephone to resolve problems. D<strong>at</strong>a were keyed with 100 percent verific<strong>at</strong>ion for surveys<br />
received by mail, fax, or telephone.<br />
A-8
Definitions <strong>of</strong> Analysis Variables<br />
• Institution type: public 2-year, priv<strong>at</strong>e 2-year, public 4-year, priv<strong>at</strong>e 4-year. Type was<br />
cre<strong>at</strong>ed from a combin<strong>at</strong>ion <strong>of</strong> level (2-year, 4-year) and control (public, priv<strong>at</strong>e). Twoyear<br />
institutions are defined as institutions <strong>at</strong> which the highest level <strong>of</strong> <strong>of</strong>fering is <strong>at</strong><br />
least 2 but less than 4 years (below the baccalaure<strong>at</strong>e degree); 4-year institutions are<br />
those <strong>at</strong> which the highest level <strong>of</strong> <strong>of</strong>fering is 4 or more years (baccalaure<strong>at</strong>e or higher<br />
degree). 17 Priv<strong>at</strong>e comprises priv<strong>at</strong>e nonpr<strong>of</strong>it and priv<strong>at</strong>e for-pr<strong>of</strong>it institutions; these<br />
priv<strong>at</strong>e institutions are reported together because there are too few priv<strong>at</strong>e for-pr<strong>of</strong>it<br />
institutions in the sample for this survey to report them as a separ<strong>at</strong>e c<strong>at</strong>egory.<br />
• Size <strong>of</strong> institution: less than 3,000 students; 3,000 to 9,999 students; and 10,000 or<br />
more students.<br />
For more inform<strong>at</strong>ion about the <strong>Postsecondary</strong> Educ<strong>at</strong>ion Quick Inform<strong>at</strong>ion System or the<br />
Survey on <strong>Dual</strong> <strong>Enrollment</strong> Programs and Courses for <strong>High</strong> <strong>School</strong> <strong>Students</strong>, contact Bernie Greene,<br />
Early Childhood, Intern<strong>at</strong>ional, and Crosscutting Studies Division, N<strong>at</strong>ional Center for Educ<strong>at</strong>ion<br />
St<strong>at</strong>istics, Institute <strong>of</strong> Educ<strong>at</strong>ion Sciences, U.S. Department <strong>of</strong> Educ<strong>at</strong>ion, 1990 K Street, NW,<br />
Washington, DC 20006; e-mail: Bernard.Greene@ed.gov; telephone (202) 502-7348.<br />
17 Definitions for level are from the d<strong>at</strong>a file document<strong>at</strong>ion for the Integr<strong>at</strong>ed <strong>Postsecondary</strong> Educ<strong>at</strong>ion D<strong>at</strong>a System (IPEDS) Institutional<br />
Characteristics file, U.S. Department <strong>of</strong> Educ<strong>at</strong>ion, N<strong>at</strong>ional Center for Educ<strong>at</strong>ion St<strong>at</strong>istics.<br />
A-9
This page intentionally left blank.<br />
A-10
Appendix B<br />
Questionnaire<br />
B-1
This page intentionally left blank.<br />
B-2
U.S. DEPARTMENT OF EDUCATION<br />
NATIONAL CENTER FOR EDUCATION STATISTICS<br />
WASHINGTON, D.C. 20006-5651<br />
FORM APPROVED<br />
O.M.B. No.: 1850–0733<br />
EXPIRATION DATE: 09/2006<br />
DUAL ENROLLMENT PROGRAMS AND COURSES FOR HIGH SCHOOL STUDENTS<br />
POSTSECONDARY EDUCATION QUICK INFORMATION SYSTEM<br />
This survey is authorized by law (P.L. 103-382). While particip<strong>at</strong>ion in this survey is voluntary, your cooper<strong>at</strong>ion is critical to make the results <strong>of</strong> this<br />
survey comprehensive, accur<strong>at</strong>e, and timely.<br />
Definition <strong>of</strong> <strong>Dual</strong> <strong>Enrollment</strong><br />
For the purposes <strong>of</strong> this survey, dual enrollment refers to high school students who earn college credits for courses taken through a<br />
postsecondary institution. Different institutions have different names for dual enrollment, including “dual credit,” “concurrent<br />
enrollment,” “joint enrollment,” etc. Please use the definition provided here when completing the survey, regardless <strong>of</strong> how your<br />
institution refers to high school students taking college-level courses. Please note th<strong>at</strong>:<br />
• Courses may be part <strong>of</strong> a dual enrollment program, or courses may be taken by students outside <strong>of</strong> any such program.<br />
‣ “<strong>Dual</strong> enrollment program” is defined here as an organized system with special guidelines th<strong>at</strong> allows high school students<br />
to take college level courses. The guidelines might have to do with entrance or eligibility requirements, funding, limits on<br />
coursetaking, and so on.<br />
‣ <strong>High</strong> school students who simply enroll in courses through your institution, and are tre<strong>at</strong>ed as regular college students,<br />
should not be considered as particip<strong>at</strong>ing in a dual enrollment program.<br />
• Credit for courses may be earned <strong>at</strong> both the high school and college level simultaneously or only <strong>at</strong> the college level. Credit<br />
may be earned immedi<strong>at</strong>ely or upon enrollment <strong>at</strong> your institution after high school gradu<strong>at</strong>ion.<br />
• Courses may be taught on a college campus, on a high school campus, or <strong>at</strong> some other loc<strong>at</strong>ion.<br />
The time frame for this survey is the 2002–03 12-month academic year, including courses taken during summer sessions. Do not<br />
include inform<strong>at</strong>ion about summer bridge programs for students who had already gradu<strong>at</strong>ed from high school.<br />
This survey should be completed by the person(s) most knowledgeable about dual enrollment <strong>at</strong> your institution.<br />
IF ABOVE INSTITUTION INFORMATION IS INCORRECT, PLEASE UPDATE DIRECTLY ON LABEL.<br />
Name <strong>of</strong> person completing form:_____________________________________<br />
Telephone:________________________<br />
Title/position: ________________________________ E-mail:<br />
Best days and times to reach you (in case <strong>of</strong> questions):_______________________________________________________<br />
THANK YOU. PLEASE KEEP A COPY OF THIS SURVEY FOR YOUR RECORDS.<br />
PLEASE RETURN COMPLETED FORM TO:<br />
IF YOU HAVE ANY QUESTIONS, CONTACT:<br />
WESTAT<br />
Brian Kleiner<br />
Attention: 7166.30—Kleiner 800–937–8281, ext. 4469 or 301–294–4469<br />
1650 Research Boulevard Fax: 800–254–0984<br />
Rockville, Maryland 20850<br />
E-mail: BrianKleiner@west<strong>at</strong>.com<br />
According to the Paperwork Reduction Act <strong>of</strong> 1995, no persons are required to respond to a collection <strong>of</strong> inform<strong>at</strong>ion unless it displays a valid OMB<br />
control number. The valid OMB control number for this inform<strong>at</strong>ion is 1850–0733. The time required to complete this inform<strong>at</strong>ion collection is estim<strong>at</strong>ed<br />
to average 30 minutes per response, including the time to review instructions, search existing d<strong>at</strong>a resources, g<strong>at</strong>her the d<strong>at</strong>a needed, and complete and<br />
review the inform<strong>at</strong>ion collected. If you have any comments concerning the accuracy <strong>of</strong> the time estim<strong>at</strong>e(s) or suggestions for improving this form,<br />
please write to: U.S. Department <strong>of</strong> Educ<strong>at</strong>ion, Washington, D.C. 20202–4651. If you have comments or concerns regarding the st<strong>at</strong>us <strong>of</strong> your<br />
individual submission <strong>of</strong> this form, write directly to: N<strong>at</strong>ional Center for Educ<strong>at</strong>ion St<strong>at</strong>istics, 1990 K Street, N.W., Washington, D.C. 20006<br />
PEQIS Form No. 14, 01/2004<br />
B-3
1. During the 2002–03 12-month academic year, did any high school students take courses for college credit through<br />
your institution? (This may include students who took courses within a dual enrollment program or on their own,<br />
outside <strong>of</strong> any program—see definition on the front <strong>of</strong> the survey.)<br />
Yes..... 1 (Continue with question 2.) No ...... 2 (Stop. Complete respondent section on front and return survey.)<br />
2. During the 2002–03 12-month academic year, did any high school students take college-level courses through your<br />
institution outside <strong>of</strong> any dual enrollment program? (These are generally high school students who simply enroll in and<br />
pay for college courses on their own and are tre<strong>at</strong>ed the same as regular college students. See definition.)<br />
Yes..... 1 (Continue with question 3.) No ...... 2 (Skip to question 4.)<br />
3. During the 2002–03 12-month academic year, how many high school students took college-level courses through<br />
your institution outside <strong>of</strong> any dual enrollment program? (Please provide unduplic<strong>at</strong>ed head counts, i.e., do not count<br />
students more than once if they took more than one course.)<br />
Number <strong>of</strong> students<br />
College-Level Courses Taken by <strong>High</strong> <strong>School</strong> <strong>Students</strong> Through Your Institution’s<br />
<strong>Dual</strong> <strong>Enrollment</strong> Program(s)<br />
• “<strong>Dual</strong> enrollment program” is defined here as an organized system with special guidelines th<strong>at</strong> allows high school students<br />
to take college-level courses. The guidelines might have to do with entrance or eligibility requirements, funding, limits on<br />
coursetaking, and so on.<br />
• <strong>High</strong> school students who simply enroll in courses through your institution, and are tre<strong>at</strong>ed as regular college students, should<br />
not be considered as particip<strong>at</strong>ing in a dual enrollment program.<br />
4. During the 2002–03 12-month academic year, did any high school students take courses for college credit through<br />
your institution th<strong>at</strong> were part <strong>of</strong> a dual enrollment program? (See definition.)<br />
Yes..... 1 (Continue with question 5.) No ...... 2 (Stop. Complete respondent section on front and return survey.)<br />
5. During the 2002–03 12-month academic year, how many high school students took college-level courses in the dual<br />
enrollment program(s) through your institution? (Please provide unduplic<strong>at</strong>ed head counts, i.e., do not count students<br />
more than once if they took more than one course.)<br />
Number <strong>of</strong> students<br />
6. Did the high school students who took courses for college credit in the dual enrollment program(s) also receive credit<br />
<strong>at</strong> the high school level for those courses? (Circle only one.)<br />
Yes..................................................................................................................................... 1<br />
No ...................................................................................................................................... 2<br />
It varied .............................................................................................................................. 3<br />
Don’t know ......................................................................................................................... 4<br />
7. Where were the courses th<strong>at</strong> were taken by high school students in the dual enrollment program(s) taught? (Circle<br />
one on each line.)<br />
Yes No<br />
a. Your college campus ........................................................................................................ 1 2<br />
b. A high school campus........................................................................................................ 1 2<br />
c. Some other loc<strong>at</strong>ion(s) (specify) 1 2<br />
If you answered “yes” to 7b (“a high school campus”), then continue with question 8. If not, skip to question 10.<br />
8. Who were the instructors <strong>of</strong> the college-level courses in the dual enrollment program(s) th<strong>at</strong> were taught on a high<br />
school campus? (Consider a high school instructor as someone primarily employed by a school district, and a college<br />
instructor as someone primarily employed by your institution.) (Circle only one.)<br />
College instructors only ............................................................................. 1 (Skip to question 10.)<br />
<strong>High</strong> school instructors only....................................................................... 2 (Continue with question 9.)<br />
Both high school and college instructors................................................... 3 (Continue with question 9.)<br />
B-4
9. How did the minimum qualific<strong>at</strong>ions for high school instructors who taught college-level courses as part <strong>of</strong> the dual<br />
enrollment program(s) compare to those required for college instructors <strong>at</strong> your institution? (Circle only one.)<br />
The same as those required for college instructors .......................................................... 1<br />
Different than those required for college instructors.......................................................... 2<br />
There was no set policy with respect to minimum qualific<strong>at</strong>ions....................................... 3<br />
It varied .............................................................................................................................. 4<br />
10. Which <strong>of</strong> the following most closely resembles the typical p<strong>at</strong>tern <strong>of</strong> high school enrollments in the dual enrollment<br />
program(s)? (A course is equivalent to 3 or 4 credits. An academic term could be a semester, quarter, or trimester.)<br />
(Circle only one.)<br />
<strong>High</strong> school students took one college course per academic term ................................... 1<br />
<strong>High</strong> school students took two college courses per academic term.................................. 2<br />
<strong>High</strong> school students took three or more college courses per academic term.................. 3<br />
The number <strong>of</strong> college courses high school students took varied considerably ............... 4<br />
Some other p<strong>at</strong>tern (specify) 5<br />
11. Wh<strong>at</strong> was the maximum number <strong>of</strong> courses per academic term (e.g., semester, quarter) a high school student was<br />
allowed to take as part <strong>of</strong> the dual enrollment program(s)? (Circle only one.)<br />
One course per academic term ......................................................................................... 1<br />
Two courses per academic term ....................................................................................... 2<br />
Three or more courses per academic term ....................................................................... 3<br />
No maximum number per academic term ......................................................................... 4<br />
12. When were high school students generally awarded college credit for courses taken through the dual enrollment<br />
program(s)? (Circle only one.)<br />
Immedi<strong>at</strong>ely upon completion <strong>of</strong> courses .......................................................................... 1<br />
Upon enrolling <strong>at</strong> your institution after high school gradu<strong>at</strong>ion ......................................... 2<br />
Other (specify) 3<br />
13. Were there academic eligibility requirements for high school students to particip<strong>at</strong>e in your institution’s dual enrollment<br />
program(s)?<br />
Yes ........... 1 (Continue with question 14.) No............... 2 (Skip to question 17.)<br />
14. Wh<strong>at</strong> were the academic eligibility requirements for high school students to particip<strong>at</strong>e in your institution’s dual<br />
enrollment program(s)? (Circle one on each line.)<br />
Yes No<br />
a. Minimum high school grade point average................................................................... 1 2<br />
b. Minimum score on a standardized test, such as the SAT.............................................. 1 2<br />
c. Minimum high school class rank........................................................................................ 1 2<br />
d. Passing a college placement test given by your institution ............................................... 1 2<br />
e. Some other requirement(s) (specify) 1 2<br />
If you answered “yes” to 14a (a minimum GPA), then continue with question 15. If not, skip to question 16.<br />
15. Wh<strong>at</strong> was the minimum high school GPA (on a 4-point scale) required by your institution for high school students to<br />
take courses in the dual enrollment program(s)? (Circle only one.)<br />
Between 1.75 and 2.24...................................................................................................... 1<br />
Between 2.25 and 2.74...................................................................................................... 2<br />
Between 2.75 and 3.24...................................................................................................... 3<br />
Between 3.25 and 3.74...................................................................................................... 4<br />
3.75 or above..................................................................................................................... 5<br />
It varied .............................................................................................................................. 6<br />
16. Were the academic requirements for high school students to be eligible to particip<strong>at</strong>e in your institution’s dual<br />
enrollment program(s) the same or different than your institution’s admissions standards for regular college students?<br />
(Circle only one.)<br />
The same..............1 Different.............. 2<br />
17. Which grade levels <strong>of</strong> high school students were eligible to take college-level courses as part <strong>of</strong> the dual enrollment<br />
program(s)? (If you had more than one program, include grade levels across all programs.) (Circle all th<strong>at</strong> apply.)<br />
9th 10th 11th 12th Some other grade(s) (specify)<br />
B-5
18. Was the curriculum (i.e., syllabus, books, exams, course length) for the college-level courses taken by high school<br />
students as part <strong>of</strong> the dual enrollment program(s) specially designed for high school students, or was it the same as<br />
for regular college students? (Circle only one.)<br />
Specially designed for high school students ..................................................................... 1<br />
The same as for regular college students ......................................................................... 2<br />
It varied .............................................................................................................................. 3<br />
19. Which sources paid tuition for the college-level courses taken by high school students in the dual enrollment<br />
program(s)? (Circle one on each line.)<br />
Yes No<br />
a. Your institution (including both your institution’s contributions and/or tuition waivers) ..... 1 2<br />
b. The st<strong>at</strong>e............................................................................................................................ 1 2<br />
c. <strong>High</strong> schools/public school districts ................................................................................... 1 2<br />
d. Parents/students................................................................................................................ 1 2<br />
e. Some other source(s) (specify) 1 2<br />
20. Wh<strong>at</strong> did high school students (and their parents) generally pay out <strong>of</strong> pocket for college-level courses taken in the<br />
dual enrollment program(s)? (Circle only one.)<br />
Full tuition .......................................................................................................................... 1<br />
Partial tuition...................................................................................................................... 2<br />
Books and/or fees only...................................................................................................... 3<br />
Nothing—tuition, books, and fees were paid in full by other sources................................ 4<br />
It varied .............................................................................................................................. 5<br />
21. During the 2002–03 12-month academic year, did your institution have a formal dual enrollment program geared<br />
specifically toward high school students who were <strong>at</strong> risk <strong>of</strong> educ<strong>at</strong>ional failure? (This program may have been<br />
included in dual enrollment programs already covered above. Only include programs in which <strong>at</strong>-risk high school<br />
students could earn college credit for courses taken.)<br />
Yes ..... 1 (Continue with question 22.) No ..... 2 (Stop. Complete respondent section on front and return survey.)<br />
22. During the 2002–03 12-month academic year, how many <strong>at</strong>-risk high school students were enrolled in th<strong>at</strong> dual<br />
enrollment program?<br />
Number <strong>of</strong> students<br />
23. Wh<strong>at</strong> was the primary focus <strong>of</strong> the dual enrollment program for <strong>at</strong>-risk high school students? (Circle only one.)<br />
Academic (e.g., m<strong>at</strong>hem<strong>at</strong>ics, English, social studies, foreign languages)....................... 1<br />
Career/technical (e.g., computer systems networking, culinary arts, metallurgy) ............. 2<br />
Equally academic and career/technical............................................................................. 3<br />
Some other primary focus (specify) 4<br />
24. Which <strong>of</strong> the following most closely resembles the typical p<strong>at</strong>tern <strong>of</strong> enrollments in the dual enrollment program for <strong>at</strong>risk<br />
high school students? (An academic term could be a semester, quarter, or trimester.) (Circle only one.)<br />
<strong>High</strong> school students took one college course per academic term ................................... 1<br />
<strong>High</strong> school students took two college courses per academic term.................................. 2<br />
<strong>High</strong> school students took three or more college courses per academic term.................. 3<br />
The number <strong>of</strong> college courses high school students took varied considerably ............... 4<br />
25. Did your institution provide extra support services specifically for the <strong>at</strong>-risk high school students in the dual<br />
enrollment program (e.g., tutoring, academic advising, study skills workshops, precollege counseling)? (Only include<br />
support services beyond those usually provided to students taking courses through your institution.)<br />
Yes ..... 1 (Continue with question 26.) No...... 2 (Stop. Complete respondent section on front and return survey.)<br />
26. Wh<strong>at</strong> extra support services were specifically <strong>of</strong>fered to the <strong>at</strong>-risk high school students in the dual enrollment<br />
program? (Only include support services beyond those usually provided to students taking courses through your<br />
institution.) (Circle one on each line.)<br />
Yes No<br />
a. Tutoring.............................................................................................................................. 1 2<br />
b. Academic advising............................................................................................................. 1 2<br />
c. Study skills workshops....................................................................................................... 1 2<br />
d. College applic<strong>at</strong>ion/selection counseling........................................................................... 1 2<br />
e. Financial aid counseling .................................................................................................... 1 2<br />
f. Some other support service(s) (specify) 1 2<br />
B-6