AWB Limited - 2003 Annual Report
AWB Limited - 2003 Annual Report
AWB Limited - 2003 Annual Report

You also want an ePaper? Increase the reach of your titles
YUMPU automatically turns print PDFs into web optimized ePapers that Google loves.
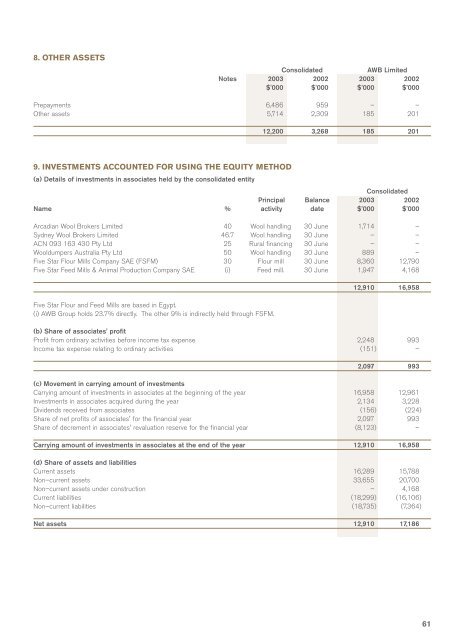
8. OTHER ASSETS<br />
Consolidated<br />
<strong>AWB</strong> <strong>Limited</strong><br />
Notes <strong>2003</strong> 2002 <strong>2003</strong> 2002<br />
$'000 $'000 $'000 $’000<br />
Prepayments<br />
Other assets<br />
6,486<br />
5,714<br />
959<br />
2,309<br />
–<br />
185<br />
–<br />
201<br />
12,200 3,268 185 201<br />
9. INVESTMENTS ACCOUNTED FOR USING THE EQUITY METHOD<br />
(a) Details of investments in associates held by the consolidated entity<br />
Consolidated<br />
Principal Balance <strong>2003</strong> 2002<br />
Name % activity date $'000 $'000<br />
Arcadian Wool Brokers <strong>Limited</strong><br />
Sydney Wool Brokers <strong>Limited</strong><br />
ACN 093 163 430 Pty Ltd<br />
Wooldumpers Australia Pty Ltd<br />
Five Star Flour Mills Company SAE (FSFM)<br />
Five Star Feed Mills & Animal Production Company SAE<br />
40 Wool handling 30 June 1,714 –<br />
46.7 Wool handling 30 June – –<br />
25 Rural financing 30 June – –<br />
50 Wool handling 30 June 889 –<br />
30 Flour mill 30 June 8,360 12,790<br />
(i) Feed mill. 30 June 1,947 4,168<br />
12,910 16,958<br />
Five Star Flour and Feed Mills are based in Egypt.<br />
(i) <strong>AWB</strong> Group holds 23.7% directly. The other 9% is indirectly held through FSFM.<br />
(b) Share of associates' profit<br />
Profit from ordinary activities before income tax expense 2,248 993<br />
Income tax expense relating to ordinary activities (151) –<br />
2,097 993<br />
(c) Movement in carrying amount of investments<br />
Carrying amount of investments in associates at the beginning of the year 16,958 12,961<br />
Investments in associates acquired during the year 2,134 3,228<br />
Dividends received from associates (156) (224)<br />
Share of net profits of associates' for the financial year 2,097 993<br />
Share of decrement in associates' revaluation reserve for the financial year (8,123) –<br />
Carrying amount of investments in associates at the end of the year 12,910 16,958<br />
(d) Share of assets and liabilities<br />
Current assets 16,289 15,788<br />
Non–current assets 33,655 20,700<br />
Non–current assets under construction – 4,168<br />
Current liabilities (18,299) (16,106)<br />
Non–current liabilities (18,735) (7,364)<br />
Net assets 12,910 17,186<br />
61