omc: no mention; hence safe - BMA Capital Management
omc: no mention; hence safe - BMA Capital Management
omc: no mention; hence safe - BMA Capital Management

You also want an ePaper? Increase the reach of your titles
YUMPU automatically turns print PDFs into web optimized ePapers that Google loves.
BUY<br />
Fair Value: PKR 282<br />
Current Price: PKR 221<br />
Stock Statistics<br />
Ticker POL<br />
3-month High/ Low 249.9/216.3<br />
Mkt Cap USD mn 618<br />
12M ADT mn 1.9<br />
Beta 1.13<br />
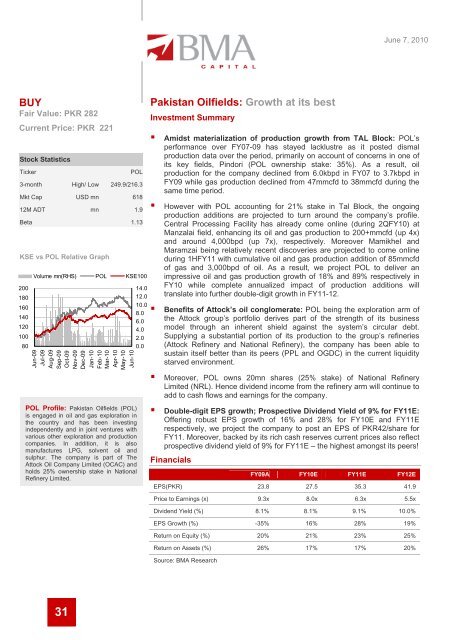
KSE vs POL Relative Graph<br />
200<br />
180<br />
160<br />
140<br />
120<br />
100<br />
80<br />
Volume mn(RHS) POL KSE100<br />
Jun-09<br />
Jul-09<br />
Aug-09<br />
Sep-09<br />
Oct-09<br />
Nov-09<br />
Dec-09<br />
Jan-10<br />
Feb-10<br />
Mar-10<br />
Apr-10<br />
May-10<br />
Jun-10<br />
POL Profile: Pakistan Oilfields (POL)<br />
is engaged in oil and gas exploration in<br />
the country and has been investing<br />
independently and in joint ventures with<br />
various other exploration and production<br />
companies. In addition, it is also<br />
manufactures LPG, solvent oil and<br />
sulphur. The company is part of The<br />
Attock Oil Company Limited (OCAC) and<br />
holds 25% ownership stake in National<br />
Refinery Limited.<br />
31<br />
14.0<br />
12.0<br />
10.0<br />
8.0<br />
6.0<br />
4.0<br />
2.0<br />
0.0<br />
Pakistan Oilfields: Growth at its best<br />
Investment Summary<br />
June 7, 2010<br />
� Amidst materialization of production growth from TAL Block: POL’s<br />
performance over FY07-09 has stayed lacklustre as it posted dismal<br />
production data over the period, primarily on account of concerns in one of<br />
its key fields, Pindori (POL ownership stake: 35%). As a result, oil<br />
production for the company declined from 6.0kbpd in FY07 to 3.7kbpd in<br />
FY09 while gas production declined from 47mmcfd to 38mmcfd during the<br />
same time period.<br />
� However with POL accounting for 21% stake in Tal Block, the ongoing<br />
production additions are projected to turn around the company’s profile.<br />
Central Processing Facility has already come online (during 2QFY10) at<br />
Manzalai field, enhancing its oil and gas production to 200+mmcfd (up 4x)<br />
and around 4,000bpd (up 7x), respectively. Moreover Mamikhel and<br />
Maramzai being relatively recent discoveries are projected to come online<br />
during 1HFY11 with cumulative oil and gas production addition of 85mmcfd<br />
of gas and 3,000bpd of oil. As a result, we project POL to deliver an<br />
impressive oil and gas production growth of 18% and 89% respectively in<br />
FY10 while complete annualized impact of production additions will<br />
translate into further double-digit growth in FY11-12.<br />
� Benefits of Attock’s oil conglomerate: POL being the exploration arm of<br />
the Attock group’s portfolio derives part of the strength of its business<br />
model through an inherent shield against the system’s circular debt.<br />
Supplying a substantial portion of its production to the group’s refineries<br />
(Attock Refinery and National Refinery), the company has been able to<br />
sustain itself better than its peers (PPL and OGDC) in the current liquidity<br />
starved environment.<br />
� Moreover, POL owns 20mn shares (25% stake) of National Refinery<br />
Limited (NRL). Hence dividend income from the refinery arm will continue to<br />
add to cash flows and earnings for the company.<br />
� Double-digit EPS growth; Prospective Dividend Yield of 9% for FY11E:<br />
Offering robust EPS growth of 16% and 28% for FY10E and FY11E<br />
respectively, we project the company to post an EPS of PKR42/share for<br />
FY11. Moreover, backed by its rich cash reserves current prices also reflect<br />
prospective dividend yield of 9% for FY11E – the highest amongst its peers!<br />
Financials<br />
FY09A FY10E FY11E FY12E<br />
EPS(PKR) 23.8 27.5 35.3 41.9<br />
Price to Earnings (x) 9.3x 8.0x 6.3x 5.5x<br />
Dividend Yield (%) 8.1% 8.1% 9.1% 10.0%<br />
EPS Growth (%) -35% 16% 28% 19%<br />
Return on Equity (%) 20% 21% 23% 25%<br />
Return on Assets (%) 26% 17% 17% 20%<br />
Source: <strong>BMA</strong> Research