omc: no mention; hence safe - BMA Capital Management
omc: no mention; hence safe - BMA Capital Management
omc: no mention; hence safe - BMA Capital Management

Create successful ePaper yourself
Turn your PDF publications into a flip-book with our unique Google optimized e-Paper software.
BUY<br />
Fair Value: PKR 236<br />
Current Price: PKR 186<br />
Stock Statistics<br />
Ticker PPL<br />
3-month High/ Low 205.6/181.6<br />
Mkt Cap USD mn 2,194<br />
12M ADT mn 1.1<br />
Beta 1.12<br />
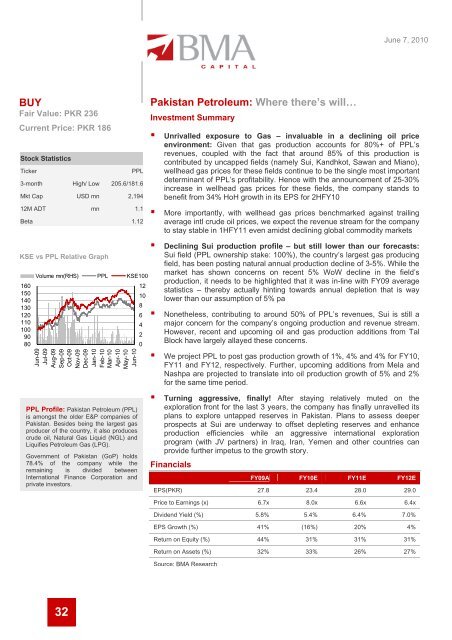
KSE vs PPL Relative Graph<br />
160<br />
150<br />
140<br />
130<br />
120<br />
110<br />
100<br />
90<br />
80<br />
Volume mn(RHS) PPL KSE100<br />
Jun-09<br />
Jul-09<br />
Aug-09<br />
Sep-09<br />
Oct-09<br />
Nov-09<br />
Dec-09<br />
Jan-10<br />
Feb-10<br />
Mar-10<br />
Apr-10<br />
May-10<br />
Jun-10<br />
PPL Profile: Pakistan Petroleum (PPL)<br />
is amongst the older E&P companies of<br />
Pakistan. Besides being the largest gas<br />
producer of the country, it also produces<br />
crude oil, Natural Gas Liquid (NGL) and<br />
Liquifies Petroleum Gas (LPG).<br />
Government of Pakistan (GoP) holds<br />
78.4% of the company while the<br />
remaining is divided between<br />
International Finance Corporation and<br />
private investors.<br />
32<br />
12<br />
10<br />
8<br />
6<br />
4<br />
2<br />
0<br />
Pakistan Petroleum: Where there’s will…<br />
Investment Summary<br />
June 7, 2010<br />
� Unrivalled exposure to Gas – invaluable in a declining oil price<br />
environment: Given that gas production accounts for 80%+ of PPL’s<br />
revenues, coupled with the fact that around 85% of this production is<br />
contributed by uncapped fields (namely Sui, Kandhkot, Sawan and Mia<strong>no</strong>),<br />
wellhead gas prices for these fields continue to be the single most important<br />
determinant of PPL’s profitability. Hence with the an<strong>no</strong>uncement of 25-30%<br />
increase in wellhead gas prices for these fields, the company stands to<br />
benefit from 34% HoH growth in its EPS for 2HFY10<br />
� More importantly, with wellhead gas prices benchmarked against trailing<br />
average intl crude oil prices, we expect the revenue stream for the company<br />
to stay stable in 1HFY11 even amidst declining global commodity markets<br />
� Declining Sui production profile – but still lower than our forecasts:<br />
Sui field (PPL ownership stake: 100%), the country’s largest gas producing<br />
field, has been posting natural annual production decline of 3-5%. While the<br />
market has shown concerns on recent 5% WoW decline in the field’s<br />
production, it needs to be highlighted that it was in-line with FY09 average<br />
statistics – thereby actually hinting towards annual depletion that is way<br />
lower than our assumption of 5% pa<br />
� Nonetheless, contributing to around 50% of PPL’s revenues, Sui is still a<br />
major concern for the company’s ongoing production and revenue stream.<br />
However, recent and upcoming oil and gas production additions from Tal<br />
Block have largely allayed these concerns.<br />
� We project PPL to post gas production growth of 1%, 4% and 4% for FY10,<br />
FY11 and FY12, respectively. Further, upcoming additions from Mela and<br />
Nashpa are projected to translate into oil production growth of 5% and 2%<br />
for the same time period.<br />
� Turning aggressive, finally! After staying relatively muted on the<br />
exploration front for the last 3 years, the company has finally unravelled its<br />
plans to explore untapped reserves in Pakistan. Plans to assess deeper<br />
prospects at Sui are underway to offset depleting reserves and enhance<br />
production efficiencies while an aggressive international exploration<br />
program (with JV partners) in Iraq, Iran, Yemen and other countries can<br />
provide further impetus to the growth story.<br />
Financials<br />
FY09A FY10E FY11E FY12E<br />
EPS(PKR) 27.8 23.4 28.0 29.0<br />
Price to Earnings (x) 6.7x 8.0x 6.6x 6.4x<br />
Dividend Yield (%) 5.8% 5.4% 6.4% 7.0%<br />
EPS Growth (%) 41% (16%) 20% 4%<br />
Return on Equity (%) 44% 31% 31% 31%<br />
Return on Assets (%) 32% 33% 26% 27%<br />
Source: <strong>BMA</strong> Research