Odonata - Entomological Society of Latvia - Latvijas Daba
Odonata - Entomological Society of Latvia - Latvijas Daba
Odonata - Entomological Society of Latvia - Latvijas Daba

Create successful ePaper yourself
Turn your PDF publications into a flip-book with our unique Google optimized e-Paper software.
2. MATERIAL AND METHODS<br />
Basic data. All freely available <strong>Latvia</strong>n dragonfly observation data are included in the<br />
dragonfly locality data base (created in Micros<strong>of</strong>t Office Access). The basic unit <strong>of</strong> a record is an<br />
observation <strong>of</strong> a species in one location in one day. The data base includes:<br />
• all published data, data collected by the author <strong>of</strong> this thesis and by other authors - 81<br />
publication;<br />
• author’s own unpublished data collected between 1991 and 2010 - 3498 entries;<br />
• unpublished data collected by entomologists before 2011 - 1595 entries;<br />
• data from museums and collections - five significant <strong>Latvia</strong>n dragonfly collections;<br />
• data from four websites and untested data <strong>of</strong> various observers, including nature management<br />
plans <strong>of</strong> specially protected natural areas data - 847 entries;<br />
• separate project and study data - 14 data sources.<br />
All data sources are enlisted in a separate publication (Kalniņš 2012d). The data base includes<br />
data regarding the place, where the species were found, date, number <strong>of</strong> individuals, sex, the stage<br />
<strong>of</strong> development, brief information about the habitat, the observer or the source <strong>of</strong> publication/data,<br />
the person who has identified the species and additional notes. The total amount <strong>of</strong> data to<br />
31.12.2010 is 12065 entries from year 1778 to 2010.<br />
2.1. RESEARCH OF THE CHANGES IN DRAGONFLY FAUNA AND DISTRIBUTION IN LATVIA<br />
Changes in the faunistic composition. For faunistic analysis dragonfly species complying<br />
with the following criteria were chosen:<br />
• species are mentioned in literature as probable for <strong>Latvia</strong>;<br />
• borders <strong>of</strong> the distribution area or separate localities are relatively close to the territory <strong>of</strong><br />
<strong>Latvia</strong> (Estonia, Europe part <strong>of</strong> Russia, Belarus, Lithuania and for several species - Poland;<br />
literature data) or they are known as species that faster disperse in northern direction;<br />
• species were recorded for the first time in <strong>Latvia</strong> during the last 20 years.<br />
The distance from <strong>Latvia</strong> to its closest locality <strong>of</strong> the species was calculated by measuring the<br />
closest distance from the locality to the border <strong>of</strong> <strong>Latvia</strong>. The distribution <strong>of</strong> southern species<br />
recorded in <strong>Latvia</strong> earlier (Спурис 1951) in northern direction was calculated by measuring the<br />
difference <strong>of</strong> latitude degrees (not certain localities!) between the historically northernmost locality<br />
and the newest northernmost locality (recorded in the last 20 years). All distances were measured by<br />
using Google Earth s<strong>of</strong>tware. Besides that, an unsystematic inspection <strong>of</strong> the potential habitats and<br />
identification <strong>of</strong> specimens were checked in the collections.<br />
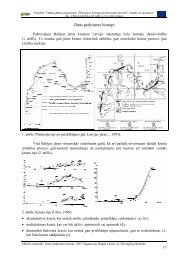
Species distribution maps were created using the <strong>Latvia</strong>n geodetic co-ordinate system <strong>of</strong> the<br />
5x5 km square system <strong>of</strong> 1992 and the topographic map system (TM-1993) <strong>of</strong> 1993 (Ģeotelpiskās...<br />
2010).<br />
The data included in the data base are subdivided in two categories (periods) - historical data<br />
(1778 - 1990) and modern data (1991 - 2010). The species distribution maps have been created<br />
using Arc GIS 9 s<strong>of</strong>tware package. For each species the occupied squares in the historic and<br />
modern period have been enlisted. The relative distribution % have been estimated for each species<br />
in each period (the number <strong>of</strong> known occupied squares in the period /the number <strong>of</strong> all studied<br />
squares in period x 100 %) (Bernard et al. 2009). The species distribution has been characterized in<br />
the scale <strong>of</strong> five classes, based on the relative distribution <strong>of</strong> the species – occupied squares vs. all<br />
surveyed squares:<br />
6. very common - frequency <strong>of</strong> occupied squares >25.1%;<br />
7. common - frequency <strong>of</strong> occupied squares 15.1-25.0;<br />
8. moderately represented - frequency <strong>of</strong> occupied squares 5.1-15.0;<br />
9. localized - frequency <strong>of</strong> occupied squares 1.1-5.0;<br />
10. very rare - frequency <strong>of</strong> occupied squares 0.1-1.0.<br />
47