anytime algorithms for learning anytime classifiers saher ... - Technion
anytime algorithms for learning anytime classifiers saher ... - Technion
anytime algorithms for learning anytime classifiers saher ... - Technion

Create successful ePaper yourself
Turn your PDF publications into a flip-book with our unique Google optimized e-Paper software.
<strong>Technion</strong> - Computer Science Department - Ph.D. Thesis PHD-2008-12 - 2008<br />
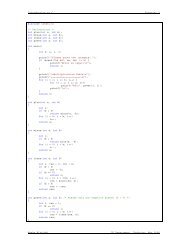
Table 4.4: Average cost of classification as a percentage of the standard cost of<br />
classification <strong>for</strong> mc = 100. The first 25 rows list <strong>for</strong> each dataset the average cost<br />
over the different 4 cost-assignments, while the last 5 rows give the results <strong>for</strong> the<br />
datasets with costs from (Turney, 1995).<br />
Dataset C4.5 LSID3 IDX CSID3 EG2 DTMC ICET ACT<br />
Breast-cancer 28.9 22.7 14.3 25.9 14.6 7.1 9.6 7.1<br />
Bupa 88.7 74.3 55.5 75.6 56.6 15.7 20.9 15.7<br />
Car 62.2 64.4 57.6 60.5 57.6 11.8 43.0 11.8<br />
Flare 3.4 3.4 6.1 4.1 6.1 3.4 3.8 3.4<br />
Glass 54.3 47.1 17.4 25.5 16.8 15.8 16.0 16.1<br />
Heart 38.5 38.1 22.7 32.3 24.0 8.7 14.3 8.6<br />
Hepatitis 26.8 20.9 9.2 17.5 10.2 3.1 5.4 3.1<br />
Iris 50.8 46.3 40.4 40.5 39.6 19.1 29.1 22.5<br />
KRK 73.6 67.9 59.7 63.1 60.4 23.4 50.4 23.4<br />
Multi-ANDOR 46.2 25.7 25.8 29.6 26.5 11.6 13.1 12.5<br />
Monks1 52.1 40.8 50.4 52.1 52.0 26.2 45.2 27.6<br />
Monks2 21.6 49.6 34.0 28.0 31.2 11.9 11.9 11.9<br />
Monks3 58.1 55.6 53.8 54.0 53.8 17.7 51.3 17.7<br />
Multiplexer 44.1 24.2 21.3 31.5 22.1 10.9 10.9 10.7<br />
MultiXOR 56.8 39.3 29.5 42.7 30.7 13.2 13.1 13.3<br />
Nursery 51.8 55.2 51.6 50.6 50.4 23.8 49.2 23.8<br />
Pima 70.5 72.1 35.7 63.2 40.7 12.4 16.2 12.5<br />
Tae 64.3 52.0 47.4 54.2 51.0 28.1 34.4 27.1<br />
Tic-tac-toe 60.4 56.1 30.7 51.4 32.1 13.5 25.3 13.5<br />
Titanic 85.3 53.4 67.6 72.2 68.2 18.4 48.2 18.4<br />
Thyroid 26.6 25.6 27.6 26.3 26.3 2.1 20.8 2.1<br />
Voting 16.8 17.8 13.3 16.5 13.9 5.6 13.4 7.0<br />
Wine 31.7 31.4 11.0 18.2 12.2 7.8 10.1 8.6<br />
XOR3d 82.2 66.1 29.4 57.8 30.9 22.0 22.5 24.1<br />
XOR5 56.0 64.0 38.9 45.4 39.9 12.4 12.4 12.4<br />
Bupa 89.8 85.2 88.7 86.7 88.7 65.1 66.5 76.2<br />
Heart 58.6 57.0 8.5 11.7 8.8 8.2 8.0 8.4<br />
Hepatitis 53.8 48.6 31.3 35.3 34.0 26.8 36.4 34.8<br />
Pima 65.8 71.4 52.0 54.4 52.0 44.7 45.7 46.6<br />
Thyroid 33.6 33.5 32.5 32.9 32.3 9.7 28.3 9.7<br />
We believe that a better tuning of cf would improve ACT in this scenario by<br />
making the pruning more aggressive.<br />
At the other extreme, when misclassification costs dominate (mc = 10000),<br />
the per<strong>for</strong>mance of DTMC is worse than ACT and ICET. The t-test indicates<br />
that ACT was significantly better than ICET 24 times and significantly worse<br />
only 7 times. According to the Wilcoxon test with α = 5%, the difference between<br />
ACT and ICET is not significant. Taking α > 5.05%, however, would turn the<br />
87