anytime algorithms for learning anytime classifiers saher ... - Technion
anytime algorithms for learning anytime classifiers saher ... - Technion
anytime algorithms for learning anytime classifiers saher ... - Technion

Create successful ePaper yourself
Turn your PDF publications into a flip-book with our unique Google optimized e-Paper software.
<strong>Technion</strong> - Computer Science Department - Ph.D. Thesis PHD-2008-12 - 2008<br />
Average size<br />
Average Accuracy<br />
4000<br />
3500<br />
3000<br />
2500<br />
2000<br />
1500<br />
ID3<br />
C4.5<br />
IIDT(1)<br />
IIDT(0.1)<br />
1000<br />
0 100 200 300 400 500 600<br />
100<br />
95<br />
90<br />
85<br />
80<br />
75<br />
70<br />
65<br />
60<br />
55<br />
50<br />
45<br />
Time [sec]<br />
0 100 200 300 400 500 600<br />
Time [sec]<br />
ID3<br />
C4.5<br />
IIDT(1)<br />
IIDT(0.1)<br />
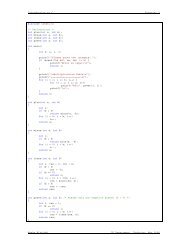
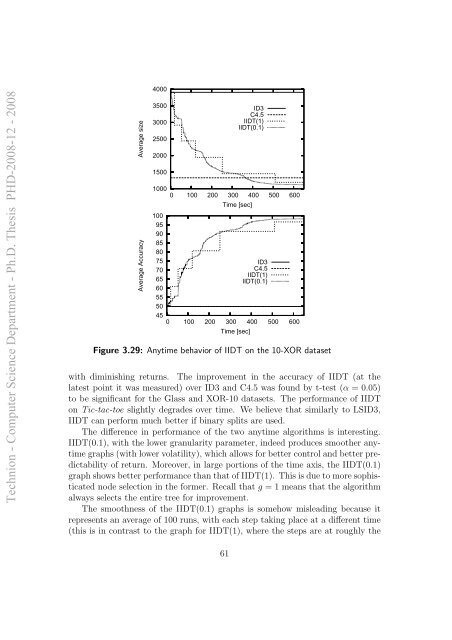
Figure 3.29: Anytime behavior of IIDT on the 10-XOR dataset<br />
with diminishing returns. The improvement in the accuracy of IIDT (at the<br />
latest point it was measured) over ID3 and C4.5 was found by t-test (α = 0.05)<br />
to be significant <strong>for</strong> the Glass and XOR-10 datasets. The per<strong>for</strong>mance of IIDT<br />
on Tic-tac-toe slightly degrades over time. We believe that similarly to LSID3,<br />
IIDT can per<strong>for</strong>m much better if binary splits are used.<br />
The difference in per<strong>for</strong>mance of the two <strong>anytime</strong> <strong>algorithms</strong> is interesting.<br />
IIDT(0.1), with the lower granularity parameter, indeed produces smoother <strong>anytime</strong><br />
graphs (with lower volatility), which allows <strong>for</strong> better control and better predictability<br />
of return. Moreover, in large portions of the time axis, the IIDT(0.1)<br />
graph shows better per<strong>for</strong>mance than that of IIDT(1). This is due to more sophisticated<br />
node selection in the <strong>for</strong>mer. Recall that g = 1 means that the algorithm<br />
always selects the entire tree <strong>for</strong> improvement.<br />
The smoothness of the IIDT(0.1) graphs is somehow misleading because it<br />
represents an average of 100 runs, with each step taking place at a different time<br />
(this is in contrast to the graph <strong>for</strong> IIDT(1), where the steps are at roughly the<br />
61