anytime algorithms for learning anytime classifiers saher ... - Technion
anytime algorithms for learning anytime classifiers saher ... - Technion
anytime algorithms for learning anytime classifiers saher ... - Technion

Create successful ePaper yourself
Turn your PDF publications into a flip-book with our unique Google optimized e-Paper software.
<strong>Technion</strong> - Computer Science Department - Ph.D. Thesis PHD-2008-12 - 2008<br />
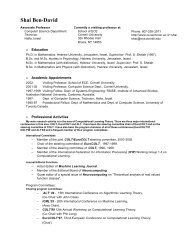
Table 3.3: The size of the induced trees on various datasets. The numbers represent<br />
the average and standard deviation over the individual runs.<br />
ID3-k LSID3 LSID3-P<br />
Dataset ID3 C4.5 (k = 2) (r = 5) (r = 5)<br />
Autos Make 53.6 ±4.2 26.6 ±1.4 56.5 ±2.4 36.6 ±2.0 37.1 ±2.0<br />
Autos Sym. 46.7 ±1.8 20.1 ±4.1 47.0 ±1.8 26.8 ±1.7 26.5 ±2.1<br />
Balance 353.9 ±6.9 34.8 ±5.5 351.6 ±7.3 347.7 ±7.7 40.1 ±6.5<br />
Br. Cancer 129.6 ±5.9 6.1 ±4.0 124.0 ±4.9 100.3 ±4.4 7.7 ±7.1<br />
Connect-4 18507 ±139 3329 ±64 16143 ±44 14531 ±168 6614 ±173<br />
Corral 9.2 ±2.1 5.3 ±1.2 7.0 ±0.6 6.7 ±0.5 6.3 ±0.8<br />
Glass 38.7 ±2.3 23.9 ±2.6 32.3 ±2.3 34.2 ±2.1 35.5 ±2.4<br />
Iris 8.5 ±1.0 4.7 ±0.5 9.1 ±0.9 7.6 ±0.8 6.6 ±1.6<br />
Monks-1 62.0 ±0.0 11.0 ±0.0 27.0 ±0.0 27.0 ±0.0 21.0 ±0.0<br />
Monks-2 109.0 ±0.0 20.0 ±0.0 105.0 ±0.0 92.4 ±3.4 18.3 ±5.0<br />
Monks-3 31.0 ±0.0 9.0 ±0.0 34.0 ±0.0 26.8 ±1.6 9.9 ±1.4<br />
Mushroom 24.0 ±0.0 19.0 ±0.2 24.9 ±0.2 16.2 ±0.9 16.2 ±0.9<br />
Solar-Flare 68.9 ±2.9 2.0 ±1.0 68.4 ±3.2 63.2 ±2.9 1.2 ±0.8<br />
Tic-tac-toe 189.0 ±13.6 83.4 ±7.8 176.7 ±9.0 151.7 ±5.6 112.6 ±8.9<br />
Voting 13.6 ±2.2 2.8 ±1.5 12.3 ±1.6 13.0 ±2.0 3.5 ±2.1<br />
Wine 7.9 ±1.0 5.3 ±0.7 7.3 ±0.9 6.2 ±0.7 7.4 ±1.3<br />
Zoo 13.8 ±0.4 8.3 ±0.8 13.8 ±0.5 9.9 ±0.8 9.8 ±0.9<br />
Numeric XOR-3D 43.0 ±5.1 1.0 ±0.1 15.6 ±6.8 9.2 ±1.0 11.7 ±1.7<br />
Numeric XOR-4d 104.7 ±4.5 2.7 ±1.8 75.5 ±14.0 26.8 ±4.7 30.9 ±5.9<br />
Multiplexer-20 142.8 ±8.3 66.1 ±6.5 67.1 ±29.0 46.6 ±20.0 41.2 ±16.8<br />
Multiplex-XOR 84.0 ±5.6 26.0 ±5.2 70.2 ±5.3 43.9 ±5.7 31.6 ±4.8<br />
XOR-5 92.3 ±7.8 21.9 ±5.3 82.1 ±9.3 32.0 ±0.0 32.0 ±0.0<br />
XOR-5 Noise 93.6 ±6.0 23.2 ±5.9 82.4 ±7.3 58.2 ±6.1 40.4 ±5.0<br />
XOR-10 3901 ±34 1367 ±39 3287 ±37 2004 ±585 1641 ±524<br />
In the case of synthetic datasets, the optimal tree size can be found in theory. 11<br />
For instance, the tree that perfectly describes the n XOR concept is of size 2 n .<br />
The results show that in this sense, the trees induced by LSID3 were almost<br />
optimal.<br />
Reducing the tree size is usually beneficial only if the associated accuracy<br />
is not reduced. Analyzing the accuracy of the produced trees shows that LSID3<br />
significantly outper<strong>for</strong>ms ID3 <strong>for</strong> most datasets. For the other datasets, the t-test<br />
values indicate that the <strong>algorithms</strong> are not significantly different. The average<br />
absolute improvement in the accuracy of LSID3 over ID3 is 11%. The Wilcoxon<br />
test (Demsar, 2006), which compares <strong>classifiers</strong> over multiple datasets, indicates<br />
that the advantage of LSID3 over ID3 is significant, with α = 0.05.<br />
The accuracy achieved by ID3-k, as shown in Figure 3.21(b), is better than<br />
set.<br />
11 Note that a theoretically optimal tree is not necessarily obtainable from a given training<br />
49