anytime algorithms for learning anytime classifiers saher ... - Technion
anytime algorithms for learning anytime classifiers saher ... - Technion
anytime algorithms for learning anytime classifiers saher ... - Technion

You also want an ePaper? Increase the reach of your titles
YUMPU automatically turns print PDFs into web optimized ePapers that Google loves.
<strong>Technion</strong> - Computer Science Department - Ph.D. Thesis PHD-2008-12 - 2008<br />
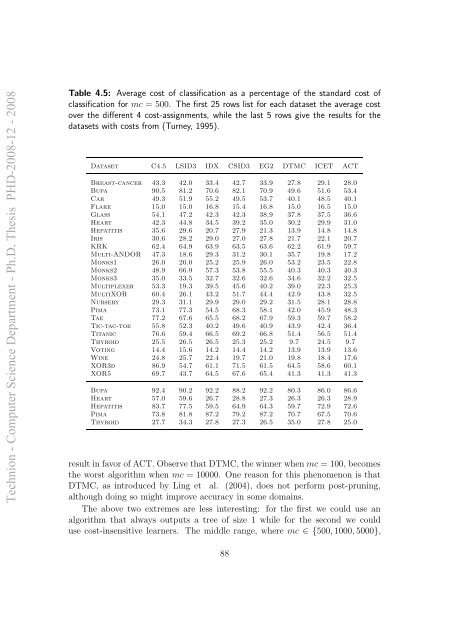
Table 4.5: Average cost of classification as a percentage of the standard cost of<br />
classification <strong>for</strong> mc = 500. The first 25 rows list <strong>for</strong> each dataset the average cost<br />
over the different 4 cost-assignments, while the last 5 rows give the results <strong>for</strong> the<br />
datasets with costs from (Turney, 1995).<br />
Dataset C4.5 LSID3 IDX CSID3 EG2 DTMC ICET ACT<br />
Breast-cancer 43.3 42.0 33.4 42.7 33.9 27.8 29.1 28.0<br />
Bupa 90.5 81.2 70.6 82.1 70.9 49.6 51.6 53.4<br />
Car 49.3 51.9 55.2 49.5 53.7 40.1 48.5 40.1<br />
Flare 15.0 15.0 16.8 15.4 16.8 15.0 16.5 15.0<br />
Glass 54.1 47.2 42.3 42.3 38.9 37.8 37.5 36.6<br />
Heart 42.3 44.8 34.5 39.2 35.0 30.2 29.9 31.0<br />
Hepatitis 35.6 29.6 20.7 27.9 21.3 13.9 14.8 14.8<br />
Iris 30.6 28.2 29.0 27.0 27.8 21.7 22.1 20.7<br />
KRK 62.4 64.9 63.9 63.5 63.6 62.2 61.9 59.7<br />
Multi-ANDOR 47.3 18.6 29.3 31.2 30.1 35.7 19.8 17.2<br />
Monks1 26.0 20.0 25.2 25.9 26.0 53.2 23.5 22.8<br />
Monks2 48.9 66.9 57.3 53.8 55.5 40.3 40.3 40.3<br />
Monks3 35.0 33.5 32.7 32.6 32.6 34.6 32.2 32.5<br />
Multiplexer 53.3 19.3 39.5 45.6 40.2 39.0 22.3 25.3<br />
MultiXOR 60.4 26.1 43.2 51.7 44.4 42.9 43.8 32.5<br />
Nursery 29.3 31.1 29.9 29.0 29.2 31.5 28.1 28.8<br />
Pima 73.1 77.3 54.5 68.3 58.1 42.0 45.9 48.3<br />
Tae 77.2 67.6 65.5 68.2 67.9 59.3 59.7 58.2<br />
Tic-tac-toe 55.8 52.3 40.2 49.6 40.9 43.9 42.4 36.4<br />
Titanic 76.6 59.4 66.5 69.2 66.8 51.4 56.5 51.4<br />
Thyroid 25.5 26.5 26.5 25.3 25.2 9.7 24.5 9.7<br />
Voting 14.4 15.6 14.2 14.4 14.2 13.9 13.9 13.6<br />
Wine 24.8 25.7 22.4 19.7 21.0 19.8 18.4 17.6<br />
XOR3d 86.9 54.7 61.1 71.5 61.5 64.5 58.6 60.1<br />
XOR5 69.7 43.7 64.5 67.6 65.4 41.3 41.3 41.3<br />
Bupa 92.4 90.2 92.2 88.2 92.2 80.3 86.0 86.6<br />
Heart 57.0 59.6 26.7 28.8 27.3 26.3 26.3 28.9<br />
Hepatitis 83.7 77.5 59.5 64.9 64.3 59.7 72.9 72.6<br />
Pima 73.8 81.8 87.2 79.2 87.2 70.7 67.5 70.6<br />
Thyroid 27.7 34.3 27.8 27.3 26.5 35.0 27.8 25.0<br />
result in favor of ACT. Observe that DTMC, the winner when mc = 100, becomes<br />
the worst algorithm when mc = 10000. One reason <strong>for</strong> this phenomenon is that<br />
DTMC, as introduced by Ling et al. (2004), does not per<strong>for</strong>m post-pruning,<br />
although doing so might improve accuracy in some domains.<br />
The above two extremes are less interesting: <strong>for</strong> the first we could use an<br />
algorithm that always outputs a tree of size 1 while <strong>for</strong> the second we could<br />
use cost-insensitive learners. The middle range, where mc ∈ {500, 1000, 5000},<br />
88