anytime algorithms for learning anytime classifiers saher ... - Technion
anytime algorithms for learning anytime classifiers saher ... - Technion
anytime algorithms for learning anytime classifiers saher ... - Technion

You also want an ePaper? Increase the reach of your titles
YUMPU automatically turns print PDFs into web optimized ePapers that Google loves.
<strong>Technion</strong> - Computer Science Department - Ph.D. Thesis PHD-2008-12 - 2008<br />
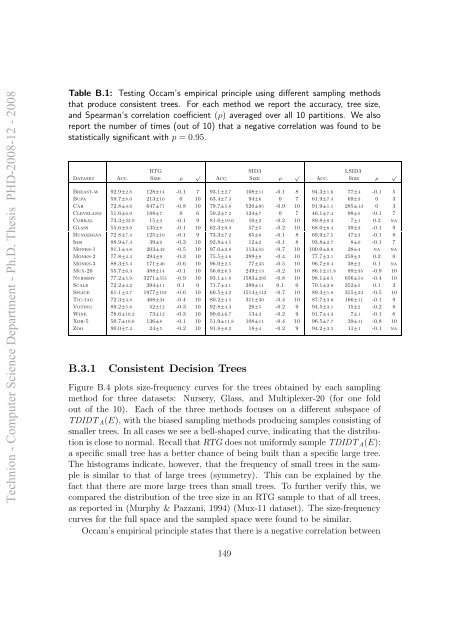
Table B.1: Testing Occam’s empirical principle using different sampling methods<br />
that produce consistent trees. For each method we report the accuracy, tree size,<br />
and Spearman’s correlation coefficient (ρ) averaged over all 10 partitions. We also<br />
report the number of times (out of 10) that a negative correlation was found to be<br />
statistically significant with p = 0.95.<br />
RTG SID3 LSID3<br />
√<br />
√<br />
Dataset Acc. Size ρ Acc. Size ρ Acc. Size ρ<br />
Breast-w 92.9±2.8 128±14 -0.1 7 93.1±2.7 108±11 -0.1 8 94.3±1.6 77±4 -0.1 5<br />
Bupa 59.7±8.0 213±10 0 10 63.4±7.3 94±6 0 7 61.9±7.4 69±3 0 3<br />
Car 72.8±4.6 647±77 -0.8 10 79.7±5.8 520±95 -0.9 10 91.9±1.1 285±13 0 3<br />
Cleveland 51.6±6.9 188±7 0 6 50.2±7.2 134±7 0 7 46.1±7.4 98±5 -0.1 7<br />
Corral 73.3±22.9 15±3 -0.1 9 81.6±19.6 10±2 -0.2 10 89.8±8.3 7±1 0.2 na<br />
Glass 55.6±9.9 135±8 -0.1 10 62.3±9.3 57±5 -0.2 10 68.0±8.4 39±3 -0.1 9<br />
Hungerian 72.8±7.4 125±10 -0.1 9 73.3±7.2 65±6 -0.1 8 69.9±7.5 47±3 -0.1 8<br />
Iris 88.9±7.3 39±9 -0.3 10 92.8±4.5 12±2 -0.1 8 93.8±2.7 8±0 -0.1 7<br />
Monks-1 91.1±4.6 203±42 -0.5 10 97.0±3.8 113±55 -0.7 10 100.0±0.0 28±4 na na<br />
Monks-2 77.8±4.4 294±9 -0.3 10 75.5±4.6 289±8 -0.4 10 77.7±3.1 259±3 0.2 0<br />
Monks-3 88.3±5.4 171±46 -0.6 10 96.0±2.5 77±33 -0.5 10 96.7±0.4 38±2 0.1 na<br />
Mux-20 55.7±6.3 388±14 -0.1 10 56.6±6.5 249±13 -0.2 10 86.1±11.8 89±35 -0.9 10<br />
Nursery 77.2±5.9 3271±551 -0.9 10 93.1±1.8 1583±295 -0.8 10 98.1±0.5 656±54 -0.4 10<br />
Scale 72.2±4.2 394±11 0.1 0 71.7±4.1 389±11 0.1 0 70.1±3.8 352±5 0.1 3<br />
Splice 61.1±3.7 1977±101 -0.6 10 60.5±4.2 1514±112 -0.7 10 89.3±1.8 355±23 -0.5 10<br />
Tic-tac 72.3±4.8 468±34 -0.4 10 80.2±4.5 311±30 -0.4 10 87.7±3.0 166±11 -0.1 9<br />
Voting 89.2±5.8 52±12 -0.3 10 92.8±4.3 26±5 -0.2 9 94.5±3.1 15±2 -0.2 8<br />
Wine 78.6±10.2 73±12 -0.3 10 90.6±6.7 13±3 -0.2 9 91.7±4.3 7±1 -0.1 6<br />
Xor-5 50.7±10.6 136±8 -0.1 10 51.9±11.8 108±11 -0.4 10 96.5±7.7 39±11 -0.8 10<br />
Zoo 90.0±7.4 24±5 -0.2 10 91.8±6.2 18±4 -0.2 9 94.2±3.5 11±1 -0.1 na<br />
B.3.1 Consistent Decision Trees<br />
Figure B.4 plots size-frequency curves <strong>for</strong> the trees obtained by each sampling<br />
method <strong>for</strong> three datasets: Nursery, Glass, and Multiplexer-20 (<strong>for</strong> one fold<br />
out of the 10). Each of the three methods focuses on a different subspace of<br />
TDIDT A(E), with the biased sampling methods producing samples consisting of<br />
smaller trees. In all cases we see a bell-shaped curve, indicating that the distribution<br />
is close to normal. Recall that RTG does not uni<strong>for</strong>mly sample TDIDT A(E):<br />
a specific small tree has a better chance of being built than a specific large tree.<br />
The histograms indicate, however, that the frequency of small trees in the sample<br />
is similar to that of large trees (symmetry). This can be explained by the<br />
fact that there are more large trees than small trees. To further verify this, we<br />
compared the distribution of the tree size in an RTG sample to that of all trees,<br />
as reported in (Murphy & Pazzani, 1994) (Mux-11 dataset). The size-frequency<br />
curves <strong>for</strong> the full space and the sampled space were found to be similar.<br />
Occam’s empirical principle states that there is a negative correlation between<br />
149<br />
√