anytime algorithms for learning anytime classifiers saher ... - Technion
anytime algorithms for learning anytime classifiers saher ... - Technion
anytime algorithms for learning anytime classifiers saher ... - Technion

You also want an ePaper? Increase the reach of your titles
YUMPU automatically turns print PDFs into web optimized ePapers that Google loves.
<strong>Technion</strong> - Computer Science Department - Ph.D. Thesis PHD-2008-12 - 2008<br />
Test costs<br />
a1<br />
a2<br />
a3<br />
a4<br />
a5<br />
a6<br />
10<br />
10<br />
10<br />
10<br />
10<br />
10<br />
MC costs<br />
FP<br />
FN<br />
1<br />
199<br />
r = 1<br />
T1 T2<br />
a3<br />
- +<br />
a1<br />
5 + 95 + 5 + 95 +<br />
95 - 5 - 95 - 5 -<br />
EE = 7.3 EE = 7.3 EE = 7.3 EE = 7.3<br />
a5<br />
- +<br />
mcost (T1) = (7.3*2*1$ + 7.3*2*199$) / 400 = 7.3$<br />
tcost (T1) = 20$<br />
total (T1) = 27.3$<br />
a4<br />
- +<br />
a2<br />
0 + 100 + 0 + 100 +<br />
50 - 50 - 50 - 50 -<br />
EE = 1.4 EE = 54.1 EE = 1.4 EE = 54.1<br />
a6<br />
- +<br />
mcost (T2) = (54.1*2*1$ + 1.4*2*199$) / 400 = 1.7$<br />
tcost (T2) = 20$<br />
total (T2) = 21.7$<br />
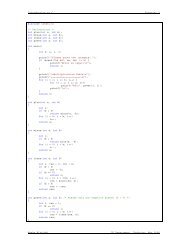
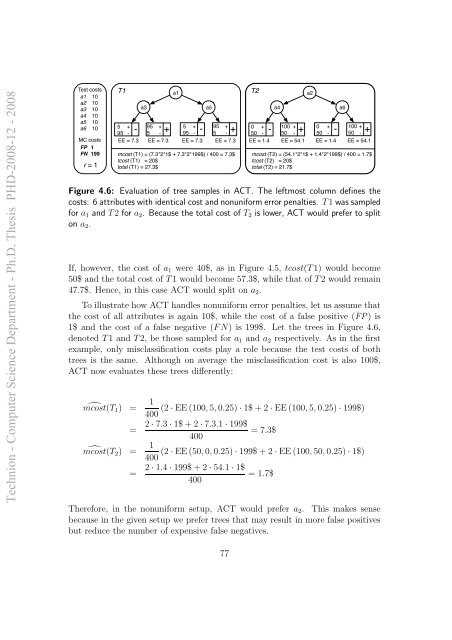
Figure 4.6: Evaluation of tree samples in ACT. The leftmost column defines the<br />
costs: 6 attributes with identical cost and nonuni<strong>for</strong>m error penalties. T1 was sampled<br />
<strong>for</strong> a1 and T2 <strong>for</strong> a2. Because the total cost of T2 is lower, ACT would prefer to split<br />
on a2.<br />
If, however, the cost of a1 were 40$, as in Figure 4.5, tcost(T1) would become<br />
50$ and the total cost of T1 would become 57.3$, while that of T2 would remain<br />
47.7$. Hence, in this case ACT would split on a2.<br />
To illustrate how ACT handles nonuni<strong>for</strong>m error penalties, let us assume that<br />
the cost of all attributes is again 10$, while the cost of a false positive (FP) is<br />
1$ and the cost of a false negative (FN) is 199$. Let the trees in Figure 4.6,<br />
denoted T1 and T2, be those sampled <strong>for</strong> a1 and a2 respectively. As in the first<br />
example, only misclassification costs play a role because the test costs of both<br />
trees is the same. Although on average the misclassification cost is also 100$,<br />
ACT now evaluates these trees differently:<br />
mcost(T1) � = 1<br />
(2 · EE (100, 5, 0.25) · 1$ + 2 · EE (100, 5, 0.25) · 199$)<br />
400<br />
= 2 · 7.3 · 1$ + 2 · 7.3.1 · 199$<br />
= 7.3$<br />
400<br />
mcost(T2) � = 1<br />
(2 · EE (50, 0, 0.25) · 199$ + 2 · EE (100, 50, 0.25) · 1$)<br />
400<br />
= 2 · 1.4 · 199$ + 2 · 54.1 · 1$<br />
= 1.7$<br />
400<br />
There<strong>for</strong>e, in the nonuni<strong>for</strong>m setup, ACT would prefer a2. This makes sense<br />
because in the given setup we prefer trees that may result in more false positives<br />
but reduce the number of expensive false negatives.<br />
77