anytime algorithms for learning anytime classifiers saher ... - Technion
anytime algorithms for learning anytime classifiers saher ... - Technion
anytime algorithms for learning anytime classifiers saher ... - Technion

You also want an ePaper? Increase the reach of your titles
YUMPU automatically turns print PDFs into web optimized ePapers that Google loves.
<strong>Technion</strong> - Computer Science Department - Ph.D. Thesis PHD-2008-12 - 2008<br />
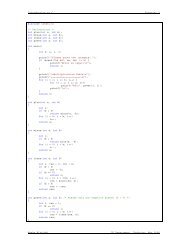
Table 3.6: The average differences between the accuracy of the different <strong>algorithms</strong><br />
and their t-test significance, with α = 0.05 ( √ indicates a significant advantage and<br />
× a significant disadvantage). The t-test is not applicable <strong>for</strong> the Monk datasets<br />
because only 1 train-test partition was used.<br />
LSID3 vs. ID3 LSID3 vs. C4.5 LSID3-P vs. C4.5<br />
Dataset Diff Sig? Diff Sig? Diff Sig?<br />
Autos Make<br />
Autos Sym.<br />
Balance<br />
1.2 ±9.9<br />
-0.6 ±11.4<br />
1.5 ±4.5<br />
∼<br />
√<br />
∼<br />
0.8 ±10.3<br />
3.9 ±12.3<br />
6.5 ±5.6<br />
√<br />
∼<br />
√<br />
-0.2 ±10.6<br />
3.7 ±12.2<br />
4.1 ±5.5<br />
√<br />
∼<br />
√<br />
Br. Cancer<br />
Connect-4<br />
Corral<br />
Glass<br />
Iris<br />
-0.2 ±9.1<br />
3.0 ±0.6<br />
13.8 ±25.4<br />
4.3 ±11.6<br />
1.1 ±4.0<br />
√<br />
∼<br />
√<br />
√<br />
√<br />
-7.8 ±9.1<br />
-2.7 ±0.5<br />
18.2 ±25.1<br />
3.0 ±12.7<br />
-0.8 ±7.8<br />
×<br />
√<br />
×<br />
√<br />
∼<br />
-3.6 ±6.0<br />
-0.9 ±0.4<br />
14.2 ±24.1<br />
2.0 ±11.5<br />
-0.9 ±7.9<br />
×<br />
√<br />
×<br />
∼<br />
∼<br />
Monks-1 17.1 ±0.0 - 24.3 ±0.0 - 18.8 ±0.0 -<br />
Monks-2 -2.2 ±0.5 - 2.0 ±0.5 - -1.5 ±1.1 -<br />
Monks-3 -3.0 ±1.5 - -5.7 ±1.5 - 0.8 ±1.3 -<br />
Mushroom 0.0 ±0.0 ∼ 0.0 ±0.0 ∼ 0.0 ±0.0 ∼<br />
Solar Flare<br />
Tic-tac-toe<br />
-0.2 ±3.0<br />
1.5 ±4.5<br />
√<br />
∼ -2.4 ±8.0<br />
1.2 ±4.8<br />
√<br />
× 0.0 ±7.6<br />
1.4 ±4.6<br />
√<br />
∼<br />
Voting 0.4 ±4.6 ∼ -0.9 ±4.4 ∼ 0.1 ±1.8 ∼<br />
Wine -0.1 ±7.4 ∼ -0.4 ±8.7 ∼ -0.6 ±10.0 ∼<br />
Zoo<br />
Numeric XOR-3D<br />
Numeric XOR-4D<br />
Multiplexer-20<br />
Multiplex-XOR<br />
XOR-5<br />
XOR-5 Noise<br />
XOR-10<br />
-1.0 ±8.0<br />
38.4 ±12.0<br />
43.4 ±7.8<br />
34.1 ±11.8<br />
18.3 ±16.2<br />
44.5 ±12.2<br />
20.3 ±17.2<br />
27.5 ±14.7<br />
√<br />
∼<br />
√<br />
√<br />
√<br />
√<br />
√<br />
√<br />
2.1 ±10.7<br />
53.1 ±7.1<br />
41.1 ±6.2<br />
33.4 ±11.0<br />
21.1 ±15.1<br />
45.9 ±12.8<br />
22.7 ±15.9<br />
27.7 ±14.8<br />
√<br />
∼<br />
√<br />
√<br />
√<br />
√<br />
√<br />
√<br />
1.3 ±10.1<br />
50.4 ±7.6<br />
39.8 ±5.9<br />
32.3 ±12.1<br />
24.7 ±14.7<br />
45.9 ±12.8<br />
26.5 ±18.2<br />
29.6 ±16.7<br />
√<br />
∼<br />
√<br />
√<br />
√<br />
√<br />
√<br />
√<br />
C4.5’s pruning are different. While LSID3 allots more time <strong>for</strong> better <strong>learning</strong> of<br />
hard concepts, pruning attempts to simplify the induced trees to avoid overfitting<br />
the data. The combination of LSID3 and pruning is shown to be worthwhile: it<br />
enjoys the benefits associated with lookahead without the need to compromise<br />
when the training set is noisy.<br />
We also examined the effect of applying error-based pruning not only to the<br />
final tree, but to the lookahead trees as well. The experiments conducted on<br />
several noisy datasets showed that the results of this extra pruning phase were<br />
very similar to the results without pruning. Although pruning results in samples<br />
that better represent the final trees, it affects all samples similarly and hence does<br />
not lead to different split decisions.<br />
52