anytime algorithms for learning anytime classifiers saher ... - Technion
anytime algorithms for learning anytime classifiers saher ... - Technion
anytime algorithms for learning anytime classifiers saher ... - Technion

Create successful ePaper yourself
Turn your PDF publications into a flip-book with our unique Google optimized e-Paper software.
<strong>Technion</strong> - Computer Science Department - Ph.D. Thesis PHD-2008-12 - 2008<br />
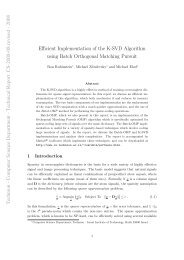
Table B.2: Testing Occam’s empirical principle when the trees are pruned. For each<br />
method we report the accuracy, tree size, percentage of pruned leaves, and Spearman’s<br />
correlation coefficient (ρ) averaged over all 10 partitions. We also report the number<br />
of times (out of 10) that a negative correlation between the size of the unpruned<br />
trees and their accuracy after pruning was found to be statistically significant with<br />
p = 0.95.<br />
RTG SID3 LSID3<br />
Dataset Acc. Size %P ρ √<br />
Acc. Size %P ρ √<br />
Acc. Size %P ρ √<br />
Breast-w 93±3 128±14 82 -0.1 9 93±3 108±11 77 -0.1 7 94±1 77±4 70 -0.3 7<br />
Bupa 63±7 213±10 86 0 7 65±7 94±6 46 0 5 62±7 69±3 11 0 2<br />
Car 81±3 647±77 93 -0.6 10 84±4 520±95 87 -0.7 10 92±2 285±13 56 -0.3 9<br />
Cleveland 55±6 188±7 73 0 5 53±7 134±7 48 0 6 47±7 98±5 12 -0.1 7<br />
Corral 75±20 15±3 67 -0.1 9 78±20 10±2 46 -0.3 10 86±13 7±1 9 0 7<br />
Glass 59±9 135±8 73 -0.1 10 64±9 57±5 25 -0.2 10 68±8 39±3 5 -0.1 9<br />
Hungerian 78±5 125±10 92 0 5 76±6 65±6 65 0 5 71±7 47±3 23 -0.1 5<br />
Iris 92±7 39±9 82 -0.2 10 94±4 12±2 47 -0.1 7 94±3 8±0 20 -0.1 5<br />
Monks-1 91±6 203±42 89 -0.6 10 95±6 113±55 77 -0.7 10 100±0 28±4 2 -0.1 na<br />
Monks-2 66±2 294±9 97 0 6 66±2 289±8 97 0 5 67±4 259±3 78 0 4<br />
Monks-3 94±5 171±46 92 -0.6 10 97±3 77±33 84 -0.6 10 99±0 38±2 65 -0.2 na<br />
Mux-20 57±6 388±14 84 -0.1 10 58±7 249±13 61 -0.2 10 88±12 89±35 32 -0.9 10<br />
Nursery 88±2 3271±551 97 -0.7 10 92±2 1583±295 90 -0.7 10 96±1 656±54 61 -0.5 10<br />
Scale 69±4 394±11 90 0 3 69±4 389±11 90 0 4 69±4 352±5 89 0.2 0<br />
Splice 63±5 1977±101 91 -0.6 10 67±5 1514±112 81 -0.6 10 92±2 355±23 58 -0.4 10<br />
Tic-tac 78±4 468±34 88 -0.3 10 81±4 311±30 77 -0.4 10 87±3 166±11 36 -0.1 6<br />
Voting 94±5 52±12 92 -0.3 10 96±2 26±5 89 -0.1 8 96±1 15±2 79 0 5<br />
Wine 82±10 73±12 84 -0.2 10 91±7 13±3 22 -0.2 9 92±4 7±1 8 -0.1 6<br />
Xor-5 55±12 136±8 85 -0.2 10 56±13 108±11 77 -0.4 10 97±7 39±11 18 -0.7 10<br />
Zoo 90±8 24±5 53 -0.2 10 91±7 18±4 34 -0.2 9 94±4 11±1 5 0 na<br />
methods. Bins with less than 5 observations were discarded. Figure B.5 plots<br />
the results <strong>for</strong> the Nursery, Glass, and Multiplexer-20 datasets. The error bars<br />
represent confidence intervals, with α = 5%.<br />
Again, the graphs show a strong correlation between size and accuracy, confirming<br />
Occam’s empirical principle. For the Nursery and Multiplexer-20 datasets<br />
the correlation is strong <strong>for</strong> all 3 samplers. For Glass, the correlation is weaker<br />
when the trees are very small. These graphs, which represent each size range in<br />
its own bin, indicate that the positive support we showed <strong>for</strong> Occam’s principle<br />
is not a result of a size bias in our sampling methods.<br />
B.3.2 Pruned Decision Trees<br />
Formally, Occam’s empirical principle, as defined in Section B.1, is applicable only<br />
to consistent hypotheses. Most decision tree learners, however, do not necessarily<br />
151