anytime algorithms for learning anytime classifiers saher ... - Technion
anytime algorithms for learning anytime classifiers saher ... - Technion
anytime algorithms for learning anytime classifiers saher ... - Technion

Create successful ePaper yourself
Turn your PDF publications into a flip-book with our unique Google optimized e-Paper software.
<strong>Technion</strong> - Computer Science Department - Ph.D. Thesis PHD-2008-12 - 2008<br />
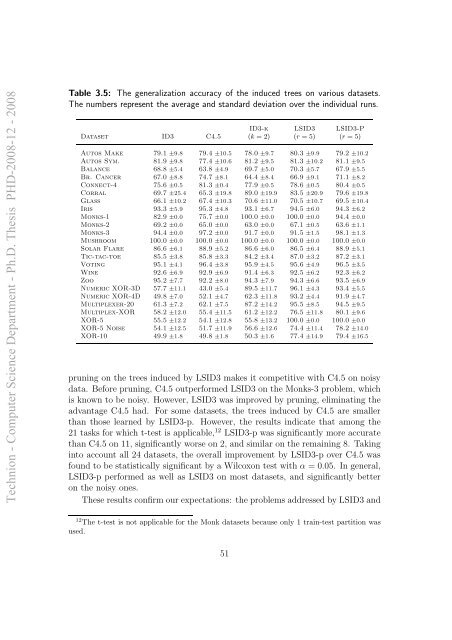
Table 3.5: The generalization accuracy of the induced trees on various datasets.<br />
The numbers represent the average and standard deviation over the individual runs.<br />
ID3-k LSID3 LSID3-P<br />
Dataset ID3 C4.5 (k = 2) (r = 5) (r = 5)<br />
Autos Make 79.1 ±9.8 79.4 ±10.5 78.0 ±9.7 80.3 ±9.9 79.2 ±10.2<br />
Autos Sym. 81.9 ±9.8 77.4 ±10.6 81.2 ±9.5 81.3 ±10.2 81.1 ±9.5<br />
Balance 68.8 ±5.4 63.8 ±4.9 69.7 ±5.0 70.3 ±5.7 67.9 ±5.5<br />
Br. Cancer 67.0 ±8.8 74.7 ±8.1 64.4 ±8.4 66.9 ±9.1 71.1 ±8.2<br />
Connect-4 75.6 ±0.5 81.3 ±0.4 77.9 ±0.5 78.6 ±0.5 80.4 ±0.5<br />
Corral 69.7 ±25.4 65.3 ±19.8 89.0 ±19.9 83.5 ±20.9 79.6 ±19.8<br />
Glass 66.1 ±10.2 67.4 ±10.3 70.6 ±11.0 70.5 ±10.7 69.5 ±10.4<br />
Iris 93.3 ±5.9 95.3 ±4.8 93.1 ±6.7 94.5 ±6.0 94.3 ±6.2<br />
Monks-1 82.9 ±0.0 75.7 ±0.0 100.0 ±0.0 100.0 ±0.0 94.4 ±0.0<br />
Monks-2 69.2 ±0.0 65.0 ±0.0 63.0 ±0.0 67.1 ±0.5 63.6 ±1.1<br />
Monks-3 94.4 ±0.0 97.2 ±0.0 91.7 ±0.0 91.5 ±1.5 98.1 ±1.3<br />
Mushroom 100.0 ±0.0 100.0 ±0.0 100.0 ±0.0 100.0 ±0.0 100.0 ±0.0<br />
Solar Flare 86.6 ±6.1 88.9 ±5.2 86.6 ±6.0 86.5 ±6.4 88.9 ±5.1<br />
Tic-tac-toe 85.5 ±3.8 85.8 ±3.3 84.2 ±3.4 87.0 ±3.2 87.2 ±3.1<br />
Voting 95.1 ±4.1 96.4 ±3.8 95.9 ±4.5 95.6 ±4.9 96.5 ±3.5<br />
Wine 92.6 ±6.9 92.9 ±6.9 91.4 ±6.3 92.5 ±6.2 92.3 ±6.2<br />
Zoo 95.2 ±7.7 92.2 ±8.0 94.3 ±7.9 94.3 ±6.6 93.5 ±6.9<br />
Numeric XOR-3D 57.7 ±11.1 43.0 ±5.4 89.5 ±11.7 96.1 ±4.3 93.4 ±5.5<br />
Numeric XOR-4D 49.8 ±7.0 52.1 ±4.7 62.3 ±11.8 93.2 ±4.4 91.9 ±4.7<br />
Multiplexer-20 61.3 ±7.2 62.1 ±7.5 87.2 ±14.2 95.5 ±8.5 94.5 ±9.5<br />
Multiplex-XOR 58.2 ±12.0 55.4 ±11.5 61.2 ±12.2 76.5 ±11.8 80.1 ±9.6<br />
XOR-5 55.5 ±12.2 54.1 ±12.8 55.8 ±13.2 100.0 ±0.0 100.0 ±0.0<br />
XOR-5 Noise 54.1 ±12.5 51.7 ±11.9 56.6 ±12.6 74.4 ±11.4 78.2 ±14.0<br />
XOR-10 49.9 ±1.8 49.8 ±1.8 50.3 ±1.6 77.4 ±14.9 79.4 ±16.5<br />
pruning on the trees induced by LSID3 makes it competitive with C4.5 on noisy<br />
data. Be<strong>for</strong>e pruning, C4.5 outper<strong>for</strong>med LSID3 on the Monks-3 problem, which<br />
is known to be noisy. However, LSID3 was improved by pruning, eliminating the<br />
advantage C4.5 had. For some datasets, the trees induced by C4.5 are smaller<br />
than those learned by LSID3-p. However, the results indicate that among the<br />
21 tasks <strong>for</strong> which t-test is applicable, 12 LSID3-p was significantly more accurate<br />
than C4.5 on 11, significantly worse on 2, and similar on the remaining 8. Taking<br />
into account all 24 datasets, the overall improvement by LSID3-p over C4.5 was<br />
found to be statistically significant by a Wilcoxon test with α = 0.05. In general,<br />
LSID3-p per<strong>for</strong>med as well as LSID3 on most datasets, and significantly better<br />
on the noisy ones.<br />
These results confirm our expectations: the problems addressed by LSID3 and<br />
12 The t-test is not applicable <strong>for</strong> the Monk datasets because only 1 train-test partition was<br />
used.<br />
51