anytime algorithms for learning anytime classifiers saher ... - Technion
anytime algorithms for learning anytime classifiers saher ... - Technion
anytime algorithms for learning anytime classifiers saher ... - Technion

You also want an ePaper? Increase the reach of your titles
YUMPU automatically turns print PDFs into web optimized ePapers that Google loves.
<strong>Technion</strong> - Computer Science Department - Ph.D. Thesis PHD-2008-12 - 2008<br />
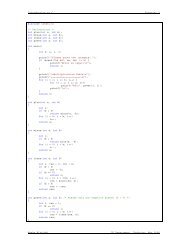
Average Size<br />
Average Accuracy<br />
200<br />
180<br />
160<br />
140<br />
120<br />
100<br />
k=3<br />
r=2<br />
80<br />
0 0.2 0.4 0.6 0.8 1 1.2<br />
92<br />
90<br />
88<br />
86<br />
84<br />
82<br />
80<br />
78<br />
r=2<br />
k=3<br />
Time [seconds]<br />
r=10<br />
LSID3<br />
ID3k<br />
ID3<br />
C4.5<br />
0 0.2 0.4 0.6 0.8 1 1.2<br />
Time [seconds]<br />
r=10<br />
LSID3<br />
ID3k<br />
ID3<br />
C4.5<br />
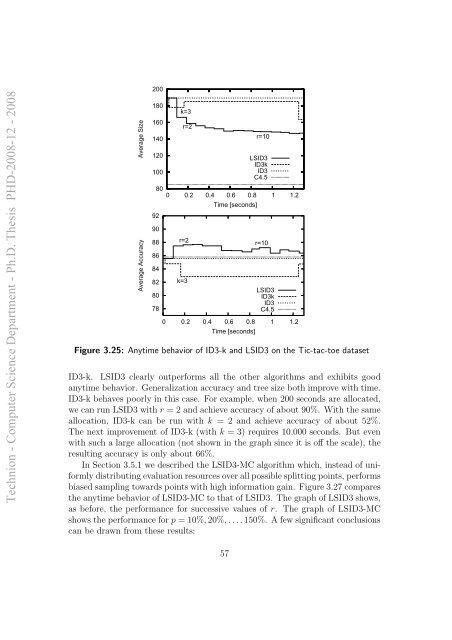
Figure 3.25: Anytime behavior of ID3-k and LSID3 on the Tic-tac-toe dataset<br />
ID3-k. LSID3 clearly outper<strong>for</strong>ms all the other <strong>algorithms</strong> and exhibits good<br />
<strong>anytime</strong> behavior. Generalization accuracy and tree size both improve with time.<br />
ID3-k behaves poorly in this case. For example, when 200 seconds are allocated,<br />
we can run LSID3 with r = 2 and achieve accuracy of about 90%. With the same<br />
allocation, ID3-k can be run with k = 2 and achieve accuracy of about 52%.<br />
The next improvement of ID3-k (with k = 3) requires 10,000 seconds. But even<br />
with such a large allocation (not shown in the graph since it is off the scale), the<br />
resulting accuracy is only about 66%.<br />
In Section 3.5.1 we described the LSID3-MC algorithm which, instead of uni<strong>for</strong>mly<br />
distributing evaluation resources over all possible splitting points, per<strong>for</strong>ms<br />
biased sampling towards points with high in<strong>for</strong>mation gain. Figure 3.27 compares<br />
the <strong>anytime</strong> behavior of LSID3-MC to that of LSID3. The graph of LSID3 shows,<br />
as be<strong>for</strong>e, the per<strong>for</strong>mance <strong>for</strong> successive values of r. The graph of LSID3-MC<br />
shows the per<strong>for</strong>mance <strong>for</strong> p = 10%, 20%, . . ., 150%. A few significant conclusions<br />
can be drawn from these results:<br />
57