Transactions
Transactions
Transactions
- No tags were found...

Create successful ePaper yourself
Turn your PDF publications into a flip-book with our unique Google optimized e-Paper software.
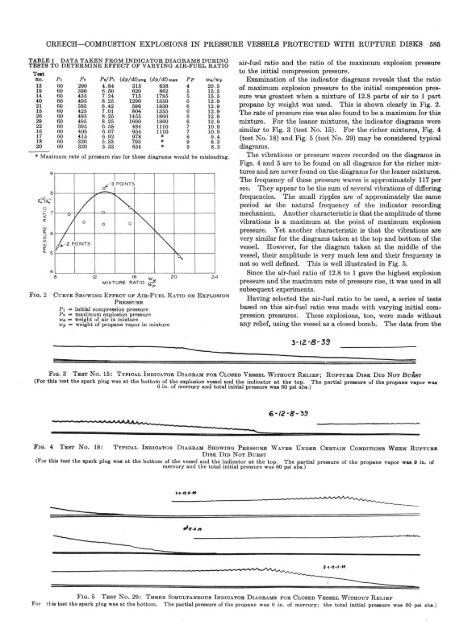
CREECH—COMBUSTION EXPLOSIONS IN PRESSURE VESSELS PROTECTED WITH RUPTURE DISKS 585TA B LE 1 DATA T A K E N FR O M IN D IC A T O R D IA G R A M S D U R IN GT E ST S TO D E T E R M IN E E F F E C T O F V A RY IN G A IR -F U E L R A TIOTeatno. P i Pt P i/P i (dp/dt) avg (dp/dt) max P p Wa/Wp13 60 290 4.84 315 638 4 20.519 60 390 6.50 620 862 5 15.514 60 435 7.24 715 1785 5 15.540 60 495 8.25 1290 1850 6 12.921 60 385 6.42 596 1830 12.915 60 425 7.01 804 1355 12.926 60 495 8.25 1455 1860 6 12.929 60 495 8.25 1660 1860 6 12.922 60 395 6.58 484 1110 7 10.916 60 405 6.67 954 1110 7 10.917 60 415 6.92 978 * 8 9 .418 60 320 5.33 793 * 9 8 .320 60 320 5.33 654 * 9 8 .3* M axim um ra te of pressure rise for these diagram s would be misleading.F iq . 2C u r v e S h o w in g E f f e c t o f A i r - F u e l R a t i o o n E x p l o s io nP r e s s u r eP i =» initial compression pressurePa = maxim um explosion pressurewa “ weight of air in m ixturewp = weight of propane vapor in m ixtureair-fuel ratio and the ratio of the maximum explosion pressureto the initial compression pressure.Examination of the indicator diagrams reveals that the ratioof maximum explosion pressure to the initial compression pressurewas greatest when a mixture of 12.8 parts of air to 1 partpropane by weight was used. This is shown clearly in Fig. 2.The rate of pressure rise was also found to be a maximum for thismixture. For the leaner mixtures, the indicator diagrams weresimilar to Fig. 3 (test No. 15). For the richer mixtures, Fig. 4(test No. 18) and Fig. 5 (test No. 29) may be considered typicaldiagrams.The vibrations or pressure waves recorded on the diagrams inFigs. 4 and 5 are to be found on all diagrams for the richer mixturesand are never found on the diagrams for the leaner mixtures.The frequency of these pressure waves is approximately 117 persec. They appear to be the sum of several vibrations of differingfrequencies. The small ripples are of approximately the sameperiod as the natural frequency of the indicator recordingmechanism. Another characteristic is that the amplitude of thesevibrations is a maximum at the point of maximum explosionpressure. Yet another characteristic is that the vibrations arevery similar for the diagrams taken at the top and bottom of thevessel. However, for the diagram taken at the middle of thevessel, their amplitude is very much less and their frequency isnot so well defined. This is well illustrated in Fig. 5.Since the air-fuel ratio of 12.8 to 1 gave the highest explosionpressure and the maximum rate of pressure rise, it was used in allsubsequent experiments.Having selected the air-fuel ratio to be used, a series of testsbased on this air-fuel ratio was made with varying initial compressionpressures. These explosions, too, were made withoutany relief, using the vessel as a closed bomb. The data from theF i g . 3 T e s t N o. 15: T y p i c a l I n d i c a t o r D ia g r a m f o r C lo s e d V e s s e l W i t h o u t R e l i e f ; R u p t u r e D is k D id N o t B u r s t(For this test th e spark plug was a t the bottom of th e explosion vessel and th e indicator a t th e to p . T he p artial pressure of th e propane vapor was6 in. of m ercury and to ta l initial pressure was 60 psi abs.)F i g . 4 T e s t N o. 18: T y p ic a l I n d ic a t o r D ia g r a m S h o w in g P r e s s u r e W a v e s U n d e r C e r t a in C o n d it io n s W h e n R u p t u r eD is k D id N ot B u r s t(For this test the spark plug was a t the b ottom of th e vessel and th e indicator a t th e top. T he p artia l pressure of th e propane vapor was 9 in. ofm ercury and the to ta l initial pressure was 60 psi abs.)F ig . 5 T e s t N o . 29: T h r e e S i m u lta n e o u s I n d i c a t o r D ia g r a m s f o r C lo s e d V e s s e l W i t h o u t R e l i e fFor this te st th e spark plug was at the bottom . The p artial pressure of the propane was 6 in. of m ercury; the to tal initial pressure was 60 psi abs.)