NORTON, KNOTT, MUENGER—FLOW PROPERTIES OF LUBRICANTS UNDER HIGH PRESSURE 641If this observation can be confirmed it will constitute an extremecase of hysteresis, and it may have an important bearing onpresent theories of the persistence of strain in solid materials.An alternative explanation might be a very rapid polymerization.P. R. V o g t . 22 The presentation of this excellent paper almosta year after Prof. Norton’s death is a tribute both to the thoroughnesswith which he prepared the foundation for this work and tohis wise choice of assistants, which left men who are able tocontinue without the benefit of his direct guidance.A more complete understanding of the change of oil viscositywith pressure will be of importance to everyone concerned withlubrication problems. In the automotive industry connectingrod-bearingloads as high as 2000 psi of projected area are commonpractice, and airplane engines sometimes use as high as 10,000psi. Assuming roughly that the maximum pressure in the oilwedge is about 4 times the load per square inch of projectedarea,23 the actual oil pressures in the foregoing applications are8000 and 40,000 psi, well within the range of greatly increasedviscosity or “apparent solidification” reported in this paper.Gear drives, especially rear axles, sometimes operate at toothcontactpressures of 300,000 psi or more; and although part of theload is sustained by direct metal-to-metal contact, considerable“apparent solidification” of the lubricant is bound to occur.This will certainly have an appreciable effect on the efficiency andlife of the drive.As yet the effects are unknown; and up to now, engineersdo not generally realize that the phenomenon even exists; buteventually it is entirely possible that the change in viscosity dueto pressure may assume as prominent a place as that now givento the change due to temperature.To this end it is desirable that the high-pressure investigationsbe continued along the lines suggested in the paper. Furthertests should be made on a wide variety of commercial lubricantssuch as engine oils, transmission oils, and extreme-pressurelubricants in an attempt to find, if possible, a correlation betweenhigh-pressure viscosity behavior and known results obtained withthe particular lubricant in actual service. In other words, doesa universally satisfactory oil have different high-pressure viscositycharacteristics from a poor oil? Of course, this will dependupon the type of service for which the oil is good or poor.Tests should be conducted with the variables of temperature,time of pressure application, and amount of previous workingheld as nearly as possible to actual service conditions. In particular,the work done on SAE 30 engine oil should be repeated atnormal engine-oil temperature of about 150 C. Therefore it issincerely to be hoped that Knott and Muenger will continue thisvaluable work.A u t h o r s’ C l o s u r eMessrs. Larson and Vogt give examples showing that a betterknowledge of pressure effects on lubricants is of importance inpractical problems of machine operation. However, Prof.Bradford correctly emphasizes the need for interpretation of thedata given in this paper before they can be applied to suchproblems. The first step might be the separation of extraneouseffects from the flow-pressure curves, such as are given in Figs.10 to 13 of the paper. Temperature rise in the test capillary;compressibility of the oil, as mentioned by Messrs. Larson andMatteson; the possibility of slippage, as mentioned by Messrs.Kleinschmidt and Mooney, lead one to suspect that the curves ofFigs. 16 to 19 of the paper have too great a curvature. It is22 Detroit, Mich. Mem. A.S.M.E.23 “ Pressure D istribution in Oil Films of Journal Bearings,” byS. A. McKee and T. R . McKee, Trans. A.S.M.E., vol. 54, 1932,paper RP-54-8, pp. 149-161.stated in the paper that these curves should be regarded as firstapproximations, and they should be verified as Mr. Mooneysuggests. There is need for further distinction between theeffects of pressure due to magnitude and those due to continuedapplication as cited by Prof. Dow. The study of hysteresisdeserves attention, and it would be desirable to shorten the timeof application of pressure so as to approach service conditions.In reply to Mr. Exline’s question, we regret that we have nodata concerning the time required for a solidified oil to return toits liquid state.It is to be hoped that refinements in technique will eliminatesome of the uncertainties mentioned in the paper. Suggestions ofMessrs. Matteson, Mooney, Morgan, and Muskat give someindication of possible steps. The determination of several pressuresalong the length of the test capillary, as suggested byMessrs. Muskat and Morgan, would indeed give useful informationon the effect of working the oil but, with the present methodsof connecting lengths of capillaries and tapping for pressuredeterminations, the flow could not be considered the same as thatfor a single capillary tube.The choice of fluids for further experiments would seem todepend upon whether the emphasis is to be placed upon explanationof the phenomena being studied or upon the accumulation ofdata for actual practical applications. The use of pure substancesand simple mixtures suggested by Mr. Kleinschmidt rather thancomplex oils should be of great interest. The solidification ofpure substances should be more sharply defined, and their shearbehavior might be much simpler. However, it is possible thatthe selective solidification of components of an oil give it shearingproperties which must be studied by use of the oil itself, ratherthan one or two of its components.The establishment of an analogy between the effect of lowtemperatures and high pressures would simplify the experimentalwork to a marked extent. As was mentioned in the foreword,Shore has called attention to an empirical linear relationship betweensolidifying pressures and temperatures, the slope of thelines being constant for several oils. That such a relationship canbe established for studying shear behavior over wide ranges ofshear is not clear. Further data seem to be necessary beforethis analogy, mentioned by Messrs. Exline and Kleinschmidt, canbe established.Mr. Matteson questions attributing Newtonian behavior tolubricating oils under normal conditions, and he suggests acomplicating variable is thereby introduced in the study ofshear behavior under pressure. Since this investigation specificallypresupposed non-Newtonian behavior in the regions to bestudied and merely set forth rate-of-shear versus shear-stresscurves at various average pressures, it is hard to see how non-Newtonian behavior at atmospheric pressure would complicatethe work. Furthermore Figs. 16, 17, and 19 show that spermoil at 0 and 20 C under 9500 psi pressure and Veedol medium at20 C and 10,000 psi are Newtonian. It is safe to assume thatthis also indicates Newtonian behavior for these oils at lowerpressures. It would not, of course, be safe to predict such behaviorat higher rates of shear than were studied. There aremany confirmations that lubricating oils behave as Newtonianliquids under normal conditions. Bradford and Villforth24 havejust recently presented such data on five oils for rates of shearup to 320,000 *_1. Any experimental verification of the hydrodynamictheory of lubrication may be considered a verificationof Newtonian behavior of the lubricant under the conditions ofthe test, for the hydrodynamic theory is based upon Newton’slaw of viscosity. Such verifications are for the so-called “thick24 “ Relationship of Viscosity to R ate of Shear,” by L. J. Bradfordand F. J. Villforth, Jr., Trans. A.S.M .E., vol. 63, 1941, pp. 359-362.
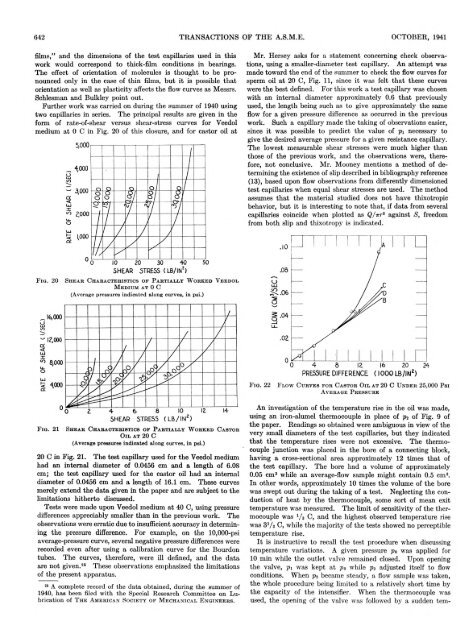
642 TRANSACTIONS OF THE A.S.M.E. OCTOBER, 1941films,” and the dimensions of the test capillaries used in thiswork would correspond to thick-film conditions in bearings.The effect of orientation of molecules is thought to be pronouncedonly in the case of thin films, but it is possible thatorientation as well as plasticity affects the flow curves as Messrs.Schlesman and Bulkley point out.Further work was carried on during the summer of 1940 usingtwo capillaries in series. The principal results are given in theform of rate-of-shear versus shear-stress curves for Veedolmedium at 0 C in Fig. 20 of this closure, and for castor oil atMr. Hersey asks for a statement concerning check observations,using a smaller-diameter test capillary. An attempt wasmade toward the end of the summer to check the flow curves forsperm oil at 20 C, Fig. 11, since it was felt that these curveswere the best defined. For this work a test capillary was chosenwith an internal diameter approximately 0.6 that previouslyused, the length being such as to give approximately the sameflow for a given pressure difference as occurred in the previouswork. Such a capillary made the taking of observations easier,since it was possible to predict the value of pi necessary togive the desired average pressure for a given resistance capillary.The lowest measurable shear stresses were much higher thanthose of the previous work, and the observations were, therefore,not conclusive. Mr. Mooney mentions a method of determiningthe existence of slip described in bibliography reference(13), based upon flow observations from differently dimensionedtest capillaries when equal shear stresses are used. The methodassumes that the material studied does not have thixotropicbehavior, but it is interesting to note that, if data from severalcapillaries coincide when plotted as Q/irr3 against S, freedomfrom both slip and thixotropy is indicated.Fig. 20 S h e a r C h a r a c t e r i s t i c s o f P a r t i a l l y W o r k e d V e e d o lM e d i u m a t 0 C(Average pressures indicated along curves, in psi.)F ig . 2 2F low C u rves for C astor Oil at 2 0 C U n d er 2 5 ,0 0 0 P siAv erage P r essu reF i g . 2 1 S h e a r C h a r a c t e r i s t i c s o f P a r t i a l l y W o r k e d C a s t o rO i l a t 20 C(Average pressures indicated along curves, in psi.)20 C in Fig. 21. The test capillary used for the Veedol mediumhad an internal diameter of 0.0456 cm and a length of 6.08cm; the test capillary used for the castor oil had an internaldiameter of 0.0456 cm and a length of 16.1 cm. These curvesmerely extend the data given in the paper and are subject to thelimitations hitherto discussed.Tests were made upon Veedol medium at 40 C, using pressuredifferences appreciably smaller than in the previous work. Theobservations were erratic due to insufficient accuracy in determiningthe pressure difference. For example, on the 10,000-psiaverage-pressure curve, several negative pressure differences wererecorded even after using a calibration curve for the Bourdontubes. The curves, therefore, were ill defined, and the dataare not given.26 These observations emphasized the limitationsof the present apparatus.26 A complete record of the data obtained, during the summer of1940, has been filed with the Special Research Com mittee on Lubricationof T h e A m e r i c a n S o c i e t y o f M e c h a n i c a l E n g i n e e r s .An investigation of the temperature rise in the oil was made,using an iron-alumel thermocouple in place of p2 of Fig. 9 ofthe paper. Readings so obtained were ambiguous in view of thevery small diameters of the test capillaries, but they indicatedthat the temperature rises were not excessive. The thermocouplejunction was placed in the bore of a connecting block,having a cross-sectional area approximately 12 times that ofthe test capillary. The bore had a volume of approximately0.05 cm3 while an average-flow sample might contain 0.5 cm3.In other words, approximately 10 times the volume of the borewas swept out during the taking of a test. Neglecting the conductionof heat by the thermocouple, some sort of mean exittemperature was measured. The limit of sensitivity of the thermocouplewas y 3 C, and the highest observed temperature risewas 3V3 C, while the majority of the tests showed no perceptibletemperature rise.It is instructive to recall the test procedure when discussingtemperature variations. A given pressure po was applied for10 min while the outlet valve remained closed. Upon openingthe valve, pi was kept at pa while p2 adjusted itself to flowconditions. When p%became steady, a flow sample was taken,the whole procedure being limited to a relatively short time bythe capacity of the intensifier. When the thermocouple wasused, the opening of the valve was followed by a sudden tem
- Page 1 and 2:
Transactionsof theHeat Transfer to
- Page 3 and 4:
H eat T ran sfer to H ydrogen-N itr
- Page 5 and 6:
COLBURN, COGHLAN—HEAT TRANSFER TO
- Page 7 and 8:
COLBURN, COGHLAN—HEAT TRANSFER TO
- Page 9 and 10:
Electric-Slip Couplings for UseW it
- Page 11 and 12:
ANDRIOLA—ELECTRIC-SLIP COUPLINGS
- Page 13 and 14:
ANDRIOLA—ELECTRIC-SLIP COUPLINGS
- Page 15 and 16:
ANDRIOLA—ELECTRIC-SLIP COUPLINGS
- Page 17 and 18:
ANDRIOLA—ELECTRIC-SLIP COUPLINGS
- Page 19 and 20:
Flexible Couplings for Internal-C o
- Page 21 and 22:
ORMONDROYD—FLEXIBLE COUPLINGS FOR
- Page 23 and 24:
ORMONDROYD—FLEXIBLE COUPLINGS FOR
- Page 25 and 26:
C om bustion Explosions in P ressur
- Page 27 and 28:
CREECH—COMBUSTION EXPLOSIONS IN P
- Page 29 and 30: CREECH—COMBUSTION EXPLOSIONS IN P
- Page 31 and 32: M athem atics of Surge Vessels and
- Page 33 and 34: MASON, PHILBRICK—MATHEMATICS OF S
- Page 35 and 36: MASON, PHILBRICK—MATHEMATICS OF S
- Page 37 and 38: MASON, PHILBRICK—MATHEMATICS OF S
- Page 39 and 40: MASON, PHILBRICK—MATHEMATICS OF S
- Page 41 and 42: MASON, PHILBRICK—MATHEMATICS OF S
- Page 43 and 44: MASON, PHILBRICK—MATHEMATICS OF S
- Page 45 and 46: 604 TRANSACTIONS OF THE A.S.M.E. OC
- Page 47 and 48: 606 TRANSACTIONS OF THE A.S.M.E. OC
- Page 49 and 50: 608 TRANSACTIONS OF THE A.S.M.E. OC
- Page 51 and 52: 610 TRANSACTIONS OF THE A.S.M.E. OC
- Page 53 and 54: TRANSACTIONS OF THE A.S.M.E. OCTOBE
- Page 55 and 56: 614 TRANSACTIONS OF THE A.S.M.E. OC
- Page 58 and 59: 618 TRANSACTIONS OF THE A.S.M.E. OC
- Page 60 and 61: 620 TRANSACTIONS OF THE A.S.M.E. OC
- Page 62 and 63: 622 TRANSACTIONS OF THE A.S.M.E. OC
- Page 64 and 65: 624 TRANSACTIONS OF THE A.S.M.E. OC
- Page 66 and 67: 626 TRANSACTIONS OF TH E A.S.M.E. O
- Page 68 and 69: 628 TRANSACTIONS OF THE A.S.M.E. OC
- Page 70 and 71: Flow P roperties of L ubricantsU nd
- Page 72 and 73: NORTON, KNOTT, MUENGER—FLOW PROPE
- Page 74 and 75: NORTON, KNOTT, MUENGER—FLOW PROPE
- Page 76 and 77: NORTON, KNOTT, MUENGER—FLOW PROPE
- Page 78 and 79: NORTON, KNOTT, MUENGER—FLOW PROPE
- Page 82 and 83: NORTON, KNOTT, MUENGER—FLOW PROPE
- Page 84 and 85: 646 TRANSACTIONS OF THE A.S.M.E. OC
- Page 86 and 87: 648 TRANSACTIONS OF THE A.S.M.E. OC
- Page 88 and 89: 650 TRANSACTIONS OF THE A.S.M.E. OC
- Page 90 and 91: 652 TRANSACTIONS OF THE A.S.M.E. OC
- Page 92 and 93: A H igh-T em perature Bolting M ate
- Page 94 and 95: WHEELER—A HIGH-TEMPERATURE BOLTIN
- Page 96 and 97: WHEELER—A HIGH-TEM PERATURE BOLTI
- Page 98 and 99: WHEELER—A HIGH-TEM PERATURE BOLTI
- Page 100 and 101: WHEELER—A HIGH-TEMPERATURE BOLTIN
- Page 102 and 103: WHEELER—A HIGH-TEMPERATURE BOLTIN
- Page 104 and 105: W HEELER—A HIGH-TEMPERATURE BOLTI