

Special Issue Survey of Cetaceans in Captive Care
Special Issue Survey of Cetaceans in Captive Care
Special Issue Survey of Cetaceans in Captive Care

You also want an ePaper? Increase the reach of your titles
YUMPU automatically turns print PDFs into web optimized ePapers that Google loves.
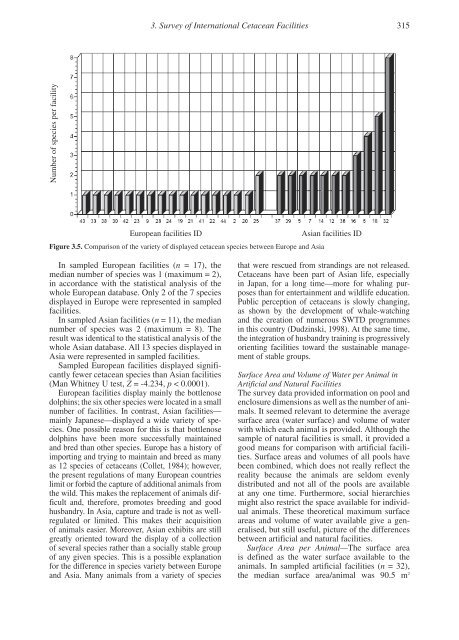
3. <strong>Survey</strong> <strong>of</strong> International Cetacean Facilities 315Number <strong>of</strong> species per facilityEuropean facilities IDFigure 3.5. Comparison <strong>of</strong> the variety <strong>of</strong> displayed cetacean species between Europe and AsiaAsian facilities IDIn sampled European facilities (n = 17), themedian number <strong>of</strong> species was 1 (maximum = 2),<strong>in</strong> accordance with the statistical analysis <strong>of</strong> thewhole European database. Only 2 <strong>of</strong> the 7 speciesdisplayed <strong>in</strong> Europe were represented <strong>in</strong> sampledfacilities.In sampled Asian facilities (n = 11), the mediannumber <strong>of</strong> species was 2 (maximum = 8). Theresult was identical to the statistical analysis <strong>of</strong> thewhole Asian database. All 13 species displayed <strong>in</strong>Asia were represented <strong>in</strong> sampled facilities.Sampled European facilities displayed significantlyfewer cetacean species than Asian facilities(Man Whitney U test, Z = -4.234, p < 0.0001).European facilities display ma<strong>in</strong>ly the bottlenosedolph<strong>in</strong>s; the six other species were located <strong>in</strong> a smallnumber <strong>of</strong> facilities. In contrast, Asian facilities—ma<strong>in</strong>ly Japanese—displayed a wide variety <strong>of</strong> species.One possible reason for this is that bottlenosedolph<strong>in</strong>s have been more successfully ma<strong>in</strong>ta<strong>in</strong>edand bred than other species. Europe has a history <strong>of</strong>import<strong>in</strong>g and try<strong>in</strong>g to ma<strong>in</strong>ta<strong>in</strong> and breed as manyas 12 species <strong>of</strong> cetaceans (Collet, 1984); however,the present regulations <strong>of</strong> many European countrieslimit or forbid the capture <strong>of</strong> additional animals fromthe wild. This makes the replacement <strong>of</strong> animals difficultand, therefore, promotes breed<strong>in</strong>g and goodhusbandry. In Asia, capture and trade is not as wellregulatedor limited. This makes their acquisition<strong>of</strong> animals easier. Moreover, Asian exhibits are stillgreatly oriented toward the display <strong>of</strong> a collection<strong>of</strong> several species rather than a socially stable group<strong>of</strong> any given species. This is a possible explanationfor the difference <strong>in</strong> species variety between Europeand Asia. Many animals from a variety <strong>of</strong> speciesthat were rescued from strand<strong>in</strong>gs are not released.<strong>Cetaceans</strong> have been part <strong>of</strong> Asian life, especially<strong>in</strong> Japan, for a long time—more for whal<strong>in</strong>g purposesthan for enterta<strong>in</strong>ment and wildlife education.Public perception <strong>of</strong> cetaceans is slowly chang<strong>in</strong>g,as shown by the development <strong>of</strong> whale-watch<strong>in</strong>gand the creation <strong>of</strong> numerous SWTD programmes<strong>in</strong> this country (Dudz<strong>in</strong>ski, 1998). At the same time,the <strong>in</strong>tegration <strong>of</strong> husbandry tra<strong>in</strong><strong>in</strong>g is progressivelyorient<strong>in</strong>g facilities toward the susta<strong>in</strong>able management<strong>of</strong> stable groups.Surface Area and Volume <strong>of</strong> Water per Animal <strong>in</strong>Artificial and Natural FacilitiesThe survey data provided <strong>in</strong>formation on pool andenclosure dimensions as well as the number <strong>of</strong> animals.It seemed relevant to determ<strong>in</strong>e the averagesurface area (water surface) and volume <strong>of</strong> waterwith which each animal is provided. Although thesample <strong>of</strong> natural facilities is small, it provided agood means for comparison with artificial facilities.Surface areas and volumes <strong>of</strong> all pools havebeen comb<strong>in</strong>ed, which does not really reflect thereality because the animals are seldom evenlydistributed and not all <strong>of</strong> the pools are availableat any one time. Furthermore, social hierarchiesmight also restrict the space available for <strong>in</strong>dividualanimals. These theoretical maximum surfaceareas and volume <strong>of</strong> water available give a generalised,but still useful, picture <strong>of</strong> the differencesbetween artificial and natural facilities.Surface Area per Animal—The surface areais def<strong>in</strong>ed as the water surface available to theanimals. In sampled artificial facilities (n = 32),the median surface area/animal was 90.5 m 2