Special Issue Survey of Cetaceans in Captive Care
Special Issue Survey of Cetaceans in Captive Care
Special Issue Survey of Cetaceans in Captive Care
Create successful ePaper yourself
Turn your PDF publications into a flip-book with our unique Google optimized e-Paper software.
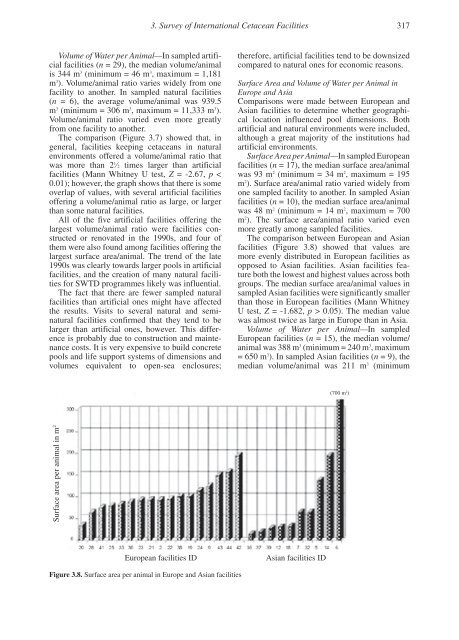
3. <strong>Survey</strong> <strong>of</strong> International Cetacean Facilities 317Volume <strong>of</strong> Water per Animal—In sampled artificialfacilities (n = 29), the median volume/animalis 344 m 3 (m<strong>in</strong>imum = 46 m 3 , maximum = 1,181m 3 ). Volume/animal ratio varies widely from onefacility to another. In sampled natural facilities(n = 6), the average volume/animal was 939.5m 3 (m<strong>in</strong>imum = 306 m 3 , maximum = 11,333 m 3 ).Volume/animal ratio varied even more greatlyfrom one facility to another.The comparison (Figure 3.7) showed that, <strong>in</strong>general, facilities keep<strong>in</strong>g cetaceans <strong>in</strong> naturalenvironments <strong>of</strong>fered a volume/animal ratio thatwas more than 2 1 ⁄2 times larger than artificialfacilities (Mann Whitney U test, Z = -2.67, p 0.05). The median valuewas almost twice as large <strong>in</strong> Europe than <strong>in</strong> Asia.Volume <strong>of</strong> Water per Animal—In sampledEuropean facilities (n = 15), the median volume/animal was 388 m 3 (m<strong>in</strong>imum = 240 m 3 , maximum= 650 m 3 ). In sampled Asian facilities (n = 9), themedian volume/animal was 211 m 3 (m<strong>in</strong>imum(700 m 2 )Surface area per animal <strong>in</strong> m 2European facilities IDAsian facilities IDFigure 3.8. Surface area per animal <strong>in</strong> Europe and Asian facilities


