2009 - Jaarverslag
2009 - Jaarverslag
2009 - Jaarverslag

Create successful ePaper yourself
Turn your PDF publications into a flip-book with our unique Google optimized e-Paper software.
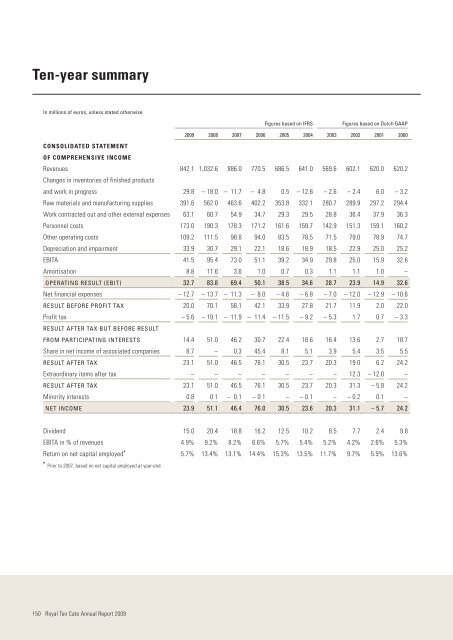
Ten-year summaryIn millions of euros, unless stated otherwiseFigures based on IFRS Figures based on Dutch GAAP<strong>2009</strong> 2008 2007 2006 2005 2004 2003 2002 2001 2000CONSOLIDATED STATEMENTOF COMPREHENSIVE INCOMERevenues 842.1 1,032.6 886.0 770.5 686.5 641.0 569.6 602.1 620.0 620.2Changes in inventories of finished productsand work in progress 29.8 – 18.0 – 11.7 – 4.8 0.5 – 12.6 – 2.6 – 2.4 6.0 – 3.2Raw materials and manufacturing supplies 391.6 562.0 463.6 402.2 353.8 332.1 280.7 289.9 297.2 294.4Work contracted out and other external expenses 63.1 60.7 54.9 34.7 29.3 29.5 28.8 36.4 37.9 36.3Personnel costs 173.0 190.3 178.3 171.2 161.6 159.7 142.9 151.3 159.1 160.2Other operating costs 109.2 111.5 98.8 94.0 83.5 78.5 71.5 79.0 78.9 74.7Depreciation and impairment 33.9 30.7 29.1 22.1 18.6 18.9 18.5 22.9 25.0 25.2EBITA 41.5 95.4 73.0 51.1 39.2 34.9 29.8 25.0 15.9 32.6Amortisation 8.8 11.6 3.6 1.0 0.7 0.3 1.1 1.1 1.0 –OPERATING RESULT (EBIT) 32.7 83.8 69.4 50.1 38.5 34.6 28.7 23.9 14.9 32.6Net financial expenses – 12.7 – 13.7 – 11.3 – 8.0 – 4.6 – 6 . 8 – 7 . 0 – 12.0 – 12.9 – 10.6RESULT BEFORE PROFIT TAX 20.0 70.1 58.1 42.1 33.9 27.8 21.7 11.9 2.0 22.0Profit tax – 5.6 – 19.1 – 11.9 – 11.4 – 11.5 – 9 . 2 – 5.3 1.7 0.7 – 3.3RESULT AFTER TAX BUT BEFORE RESULTFROM PARTICIPATING INTERESTS 14.4 51.0 46.2 30.7 22.4 18.6 16.4 13.6 2.7 18.7Share in net income of associated companies 8.7 – 0.3 45.4 8.1 5 . 1 3 . 9 5.4 3.5 5.5RESULT AFTER TAX 23.1 51.0 46.5 76.1 30.5 23.7 20.3 19.0 6.2 24.2Extraordinary items after tax – – – – – – – 12.3 – 12.0 –RESULT AFTER TAX 23.1 51.0 46.5 76.1 30.5 23.7 20.3 31.3 – 5.8 24.2Minority interests 0.8 0.1 – 0.1 – 0.1 – – 0.1 – – 0.2 0.1 –NET INCOME 23.9 51.1 46.4 76.0 30.5 23.6 20.3 31.1 – 5.7 24.2Dividend 15.0 20.4 18.8 16.2 12.5 10.2 8.5 7.7 2.4 9.8EBITA in % of revenues 4.9% 9.2% 8.2% 6.6% 5.7% 5.4% 5.2% 4.2% 2.6% 5.3%Return on net capital employed * 5.7% 13.4% 13.1% 14.4% 15.3% 13.5% 11.7% 9.7% 5.9% 13.6%* Prior to 2007, based on net capital employed at year-end.150Royal Ten Cate Annual Report <strong>2009</strong>