2009 - Jaarverslag
2009 - Jaarverslag
2009 - Jaarverslag

You also want an ePaper? Increase the reach of your titles
YUMPU automatically turns print PDFs into web optimized ePapers that Google loves.
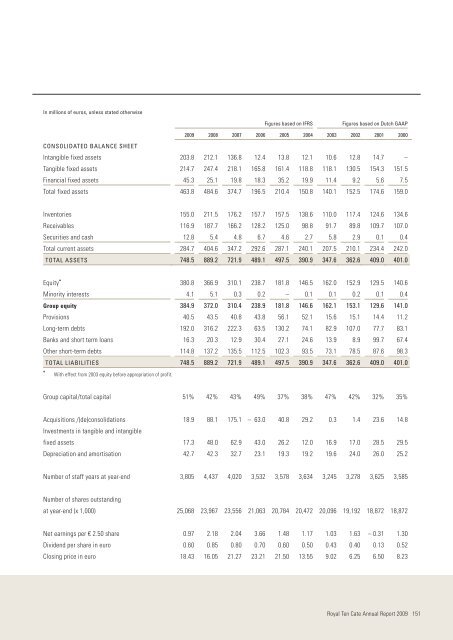
In millions of euros, unless stated otherwiseFigures based on IFRS Figures based on Dutch GAAP<strong>2009</strong> 2008 2007 2006 2005 2004 2003 2002 2001 2000CONSOLIDATED BALANCE SHEETIntangible fixed assets 203.8 212.1 136.8 12.4 13.8 12.1 10.6 12.8 14.7 –Tangible fixed assets 214.7 247.4 218.1 165.8 161.4 118.8 118.1 130.5 154.3 151.5Financial fixed assets 45.3 25.1 19.8 18.3 35.2 19.9 11.4 9.2 5 . 6 7.5Total fixed assets 463.8 484.6 374.7 196.5 210.4 150.8 140.1 152.5 174.6 159.0Inventories 155.0 211.5 176.2 157.7 157.5 138.6 110.0 117.4 124.6 134.6Receivables 116.9 187.7 166.2 128.2 125.0 98.8 91.7 89.8 109.7 107.0Securities and cash 12.8 5.4 4.8 6.7 4.6 2 . 7 5 . 8 2 . 9 0 . 1 0.4Total current assets 284.7 404.6 347.2 292.6 287.1 240.1 207.5 210.1 234.4 242.0TOTAL ASSETS 748.5 889.2 721.9 489.1 497.5 390.9 347.6 362.6 409.0 401.0Equity * 380.8 366.9 310.1 238.7 181.8 146.5 162.0 152.9 129.5 140.6Minority interests 4.1 5.1 0.3 0.2 – 0 . 1 0 . 1 0 . 2 0 . 1 0.4Group equity 384.9 372.0 310.4 238.9 181.8 146.6 162.1 153.1 129.6 141.0Provisions 40.5 43.5 40.8 43.8 56.1 52.1 15.6 15.1 14.4 11.2Long-term debts 192.0 316.2 222.3 63.5 130.2 74.1 82.9 107.0 77.7 83.1Banks and short term loans 16.3 20.3 12.9 30.4 27.1 24.6 13.9 8.9 99.7 67.4Other short-term debts 114.8 137.2 135.5 112.5 102.3 93.5 73.1 78.5 87.6 98.3TOTAL LIABILITIES 748.5 889.2 721.9 489.1 497.5 390.9 347.6 362.6 409.0 401.0*With effect from 2003 equity before appropriation of profit.Group capital/total capital 51% 42% 43% 49% 37% 38% 47% 42% 32% 35%Acquisitions /(de)consolidations 18.9 88.1 175.1 – 63.0 40.8 29.2 0.3 1.4 23.6 14.8Investments in tangible and intangiblefixed assets 17.3 48.0 62.9 43.0 26.2 12.0 16.9 17.0 28.5 29.5Depreciation and amortisation 42.7 42.3 32.7 23.1 19.3 19.2 19.6 24.0 26.0 25.2Number of staff years at year-end 3,805 4,437 4,020 3,532 3,578 3,634 3,245 3,278 3,625 3,585Number of shares outstandingat year-end (x 1,000) 25,068 23,967 23,556 21,063 20,784 20,472 20,096 19,192 18,872 18,872Net earnings per € 2.50 share 0.97 2.18 2.04 3.66 1.48 1.17 1.03 1.63 – 0.31 1.30Dividend per share in euro 0.60 0.85 0.80 0.70 0.60 0.50 0.43 0.40 0.13 0.52Closing price in euro 18.43 16.05 21.27 23.21 21.50 13.55 9.02 6.25 6.50 8.23Royal Ten Cate Annual Report <strong>2009</strong> 151