Quality Award Brochure 2011-a4.p65 - Hong Kong Management ...
Quality Award Brochure 2011-a4.p65 - Hong Kong Management ...
Quality Award Brochure 2011-a4.p65 - Hong Kong Management ...

Create successful ePaper yourself
Turn your PDF publications into a flip-book with our unique Google optimized e-Paper software.
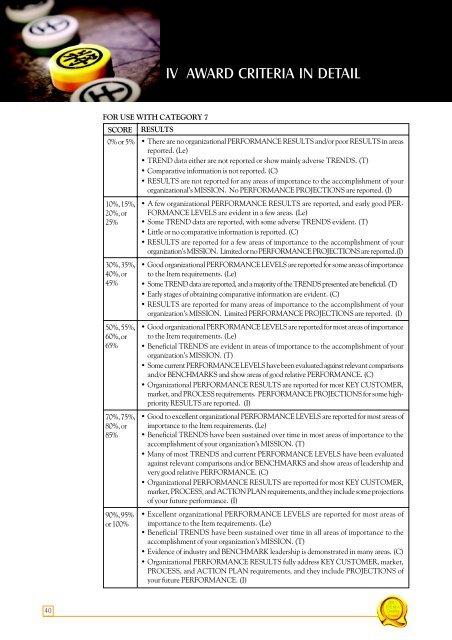
IV AWARD CRITERIA IN DETAILFOR USE WITH CATEGORY 7SCORE RESULTS0% or 5% • There are no organizational PERFORMANCE RESULTS and/or poor RESULTS in areasreported. (Le)• TREND data either are not reported or show mainly adverse TRENDS. (T)• Comparative information is not reported. (C)• RESULTS are not reported for any areas of importance to the accomplishment of yourorganizational’s MISSION. No PERFORMANCE PROJECTIONS are reported. (I)10%, 15%,20%, or25%30%, 35%,40%, or45%50%, 55%,60%, or65%70%, 75%,80%, or85%90%, 95%or 100%• A few organizational PERFORMANCE RESULTS are reported, and early good PER-FORMANCE LEVELS are evident in a few areas. (Le)• Some TREND data are reported, with some adverse TRENDS evident. (T)• Little or no comparative information is reported. (C)• RESULTS are reported for a few areas of importance to the accomplishment of yourorganization’s MISSION. Limited or no PERFORMANCE PROJECTIONS are reported.(I)• Good organizational PERFORMANCE LEVELS are reported for some areas of importanceto the Item requirements. (Le)• Some TREND data are reported, and a majority of the TRENDS presented are beneficial. (T)• Early stages of obtaining comparative information are evident. (C)• RESULTS are reported for many areas of importance to the accomplishment of yourorganization’s MISSION. Limited PERFORMANCE PROJECTIONS are reported. (I)• Good organizational PERFORMANCE LEVELS are reported for most areas of importanceto the Item requirements. (Le)• Beneficial TRENDS are evident in areas of importance to the accomplishment of yourorganization’s MISSION. (T)• Some current PERFORMANCE LEVELS have been evaluated against relevant comparisonsand/or BENCHMARKS and show areas of good relative PERFORMANCE. (C)• Organizational PERFORMANCE RESULTS are reported for most KEY CUSTOMER,market, and PROCESS requirements. PERFORMANCE PROJECTIONS for some highpriorityRESULTS are reported. (I)• Good to excellent organizational PERFORMANCE LEVELS are reported for most areas ofimportance to the Item requirements. (Le)• Beneficial TRENDS have been sustained over time in most areas of importance to theaccomplishment of your organization’s MISSION. (T)• Many of most TRENDS and current PERFORMANCE LEVELS have been evaluatedagainst relevant comparisons and/or BENCHMARKS and show areas of leadership andvery good relative PERFORMANCE. (C)• Organizational PERFORMANCE RESULTS are reported for most KEY CUSTOMER,market, PROCESS, and ACTION PLAN requirements, and they include some projectionsof your future performance. (I)• Excellent organizational PERFORMANCE LEVELS are reported for most areas ofimportance to the Item requirements. (Le)• Beneficial TRENDS have been sustained over time in all areas of importance to theaccomplishment of your organization’s MISSION. (T)• Evidence of industry and BENCHMARK leadership is demonstrated in many areas. (C)• Organizational PERFORMANCE RESULTS fully address KEY CUSTOMER, market,PROCESS, and ACTION PLAN requirements, and they include PROJECTIONS ofyour future PERFORMANCE. (I)40