Language developmentIn all three waves, primary carers were asked if theyhad any concerns about their children’s languagedevelopment. The questions were adapted from ‘ParentEvaluation <strong>of</strong> Developmental Status’ (PEDS), the Australianversion, with the assistance <strong>of</strong> the Centre for CommunityChild Health (2005).Table 3 shows the proportions <strong>of</strong> children whose primarycarers indicated concerns about their receptive(understanding) and expressive (speaking) language skillsin waves 1 and 3. Most primary carers did not express anyconcerns about their children’s language development.However more primary carers expressed concerns abouttheir child’s speech than about their understanding.How persistent are concerns about languagedevelopment? That is, do the primary carers <strong>of</strong> the samechildren express concern in each wave, or are mostconcerns resolved by the time <strong>of</strong> subsequent interview?Table 4 and Table 5 shed some light on this by showingproportions <strong>of</strong> primary carers who expressed concernsabout their children’s language development in wave 3,depending on their responses in wave 1. Of the primarycarers who expressed concern in wave 1, the majoritywere no longer concerned by the time they were askedin wave 3, and primary carers who did not have concernsat wave 1 were less likely to express concern at wave 3.Concerns about expressive language were more likelyto persist than those about receptive language. Speechconcerns were also more likely to emerge in wave 3than concerns about understanding; 13.2 per cent <strong>of</strong>the primary carers who had no concerns about theirchildren’s expressive language at the time <strong>of</strong> the wave 1interview expressed some concern at wave 3, comparedwith only 4.1 per cent for receptive language.The main area <strong>of</strong> concern about receptive languagewas that the child had difficulty in understanding whatthe primary carer said. For those who had concernsabout expressive language, the main area <strong>of</strong> concernwas the clarity <strong>of</strong> speech. Difficulty putting wordstogether and stuttering, stammering or lisping were also<strong>of</strong> concern to 4.7 per cent and 5.9 per cent <strong>of</strong> primarycarers respectively.Table 3: Primary carers’ concerns about children’s language development, waves 1 and 3, per centWave 1 Wave 3Concern about children’slanguage developmentReceptivelanguageExpressivelanguageReceptivelanguageExpressivelanguageNo concerns 94.3 84.5 94.4 82.8Some concern 5.7 12.9 5.6 17.2Child not speaking yet – 2.6 – –Number <strong>of</strong> respondents 1,661 1,642 1,404 1,402Note:Data are for children whose primary carers responded ’yes’, ’a little’ or ’no’ to the questions on concerns about speech andunderstanding. The responses ’a little’ and ’yes’ were grouped into the ’some concern’ category. The small number <strong>of</strong> caseswhere the primary carer was unsure or refused to answer were excluded from the analysis, hence the varying number <strong>of</strong>respondents. The total number <strong>of</strong> respondents was 1670 in wave 1 and 1404 in wave 3.Table 4: Persistence <strong>of</strong> concerns about the child’s expressive language, waves 1 and 3Child’s speech in wave 1Primary carer’s concerns about child’sspeech in wave 3, per centNo concernsSome concernsNumber <strong>of</strong>respondentsNot speaking yet 67.6 32.4 37Primary carer had no concerns 86.8 13.2 1,102Primary carer had some concerns 58.0 42.0 169Note:Data are for 1,308 children whose primary carers responded ’yes’, ’a little’ or ’no’ to the question ’Do you have any concernsabout how the child talks and makes speech sounds?’ at waves 1 and 3, and those who indicated that the child could not yetpronounce any words they could recognise at wave 1. Responses ’a little’ and ‘yes’ were grouped together.14 Footprints in Time: The Longitudinal Study <strong>of</strong> Indigenous Children | Key <strong>Summary</strong> <strong>Report</strong> from Wave 3
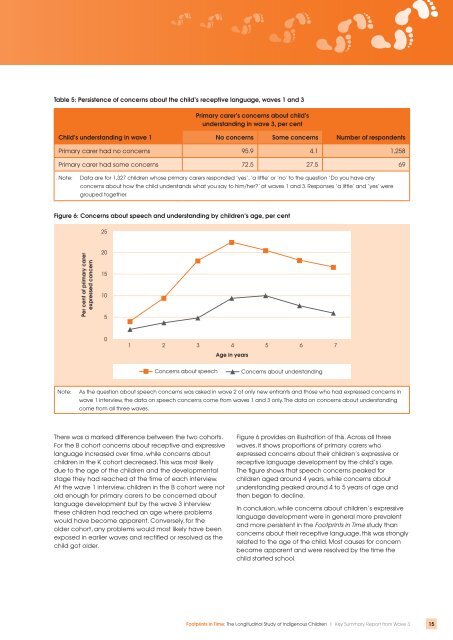
Table 5: Persistence <strong>of</strong> concerns about the child’s receptive language, waves 1 and 3Primary carer’s concerns about child’sunderstanding in wave 3, per centChild’s understanding in wave 1No concernsSome concernsNumber <strong>of</strong> respondentsPrimary carer had no concerns 95.9 4.1 1,258Primary carer had some concerns 72.5 27.5 69Note:Data are for 1,327 children whose primary carers responded ’yes’, ’a little’ or ’no’ to the question ’Do you have anyconcerns about how the child understands what you say to him/her?’ at waves 1 and 3. Responses ’a little’ and ’yes’ weregrouped together.Figure 6: Concerns about speech and understanding by children’s age, per centNote:As the question about speech concerns was asked in wave 2 <strong>of</strong> only new entrants and those who had expressed concerns inwave 1 interview, the data on speech concerns come from waves 1 and 3 only. The data on concerns about understandingcome from all three waves.There was a marked difference between the two cohorts.For the B cohort concerns about receptive and expressivelanguage increased over time, while concerns aboutchildren in the K cohort decreased. This was most likelydue to the age <strong>of</strong> the children and the developmentalstage they had reached at the time <strong>of</strong> each interview.At the wave 1 interview, children in the B cohort were notold enough for primary carers to be concerned aboutlanguage development but by the wave 3 interviewthese children had reached an age where problemswould have become apparent. Conversely, for theolder cohort, any problems would most likely have beenexposed in earlier waves and rectified or resolved as thechild got older.Figure 6 provides an illustration <strong>of</strong> this. Across all threewaves, it shows proportions <strong>of</strong> primary carers whoexpressed concerns about their children’s expressive orreceptive language development by the child’s age.The figure shows that speech concerns peaked forchildren aged around 4 years, while concerns aboutunderstanding peaked around 4 to 5 years <strong>of</strong> age andthen began to decline.In conclusion, while concerns about children’s expressivelanguage development were in general more prevalentand more persistent in the Footprints in Time study thanconcerns about their receptive language, this was stronglyrelated to the age <strong>of</strong> the child. Most causes for concernbecame apparent and were resolved by the time thechild started school.Footprints in Time: The Longitudinal Study <strong>of</strong> Indigenous Children | Key <strong>Summary</strong> <strong>Report</strong> from Wave 315


![pdf [107kB] - Department of Families, Housing, Community Services](https://img.yumpu.com/51272499/1/190x245/pdf-107kb-department-of-families-housing-community-services.jpg?quality=85)


![Land Claim - pdf [278kB] - Department of Families, Housing ...](https://img.yumpu.com/47002639/1/184x260/land-claim-pdf-278kb-department-of-families-housing-.jpg?quality=85)

![Borroloola Land Claim - pdf [299kB] - Department of Families ...](https://img.yumpu.com/46103973/1/184x260/borroloola-land-claim-pdf-299kb-department-of-families-.jpg?quality=85)