

Summary Report - pdf - Department of Families, Housing ...
Summary Report - pdf - Department of Families, Housing ...
Summary Report - pdf - Department of Families, Housing ...

You also want an ePaper? Increase the reach of your titles
YUMPU automatically turns print PDFs into web optimized ePapers that Google loves.
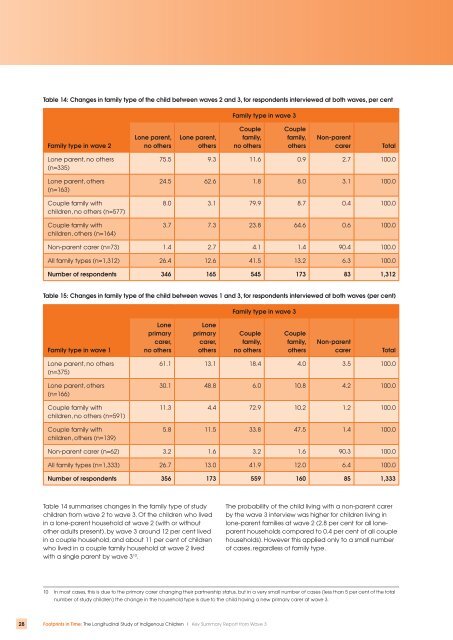
Table 14: Changes in family type <strong>of</strong> the child between waves 2 and 3, for respondents interviewed at both waves, per centFamily type in wave 3Family type in wave 2Lone parent,no othersLone parent,othersCouplefamily,no othersCouplefamily,othersNon-parentcarerTotalLone parent, no others(n=335)Lone parent, others(n=163)Couple family withchildren, no others (n=577)Couple family withchildren, others (n=164)75.5 9.3 11.6 0.9 2.7 100.024.5 62.6 1.8 8.0 3.1 100.08.0 3.1 79.9 8.7 0.4 100.03.7 7.3 23.8 64.6 0.6 100.0Non-parent carer (n=73) 1.4 2.7 4.1 1.4 90.4 100.0All family types (n=1,312) 26.4 12.6 41.5 13.2 6.3 100.0Number <strong>of</strong> respondents 346 165 545 173 83 1,312Table 15: Changes in family type <strong>of</strong> the child between waves 1 and 3, for respondents interviewed at both waves (per cent)Family type in wave 3Family type in wave 1Loneprimarycarer,no othersLoneprimarycarer,othersCouplefamily,no othersCouplefamily,othersNon-parentcarerTotalLone parent, no others(n=375)Lone parent, others(n=166)Couple family withchildren, no others (n=591)Couple family withchildren, others (n=139)61.1 13.1 18.4 4.0 3.5 100.030.1 48.8 6.0 10.8 4.2 100.011.3 4.4 72.9 10.2 1.2 100.05.8 11.5 33.8 47.5 1.4 100.0Non-parent carer (n=62) 3.2 1.6 3.2 1.6 90.3 100.0All family types (n=1,333) 26.7 13.0 41.9 12.0 6.4 100.0Number <strong>of</strong> respondents 356 173 559 160 85 1,333Table 14 summarises changes in the family type <strong>of</strong> studychildren from wave 2 to wave 3. Of the children who livedin a lone-parent household at wave 2 (with or withoutother adults present), by wave 3 around 12 per cent livedin a couple household, and about 11 per cent <strong>of</strong> childrenwho lived in a couple family household at wave 2 livedwith a single parent by wave 3 10 .The probability <strong>of</strong> the child living with a non-parent carerby the wave 3 interview was higher for children living inlone-parent families at wave 2 (2.8 per cent for all loneparenthouseholds compared to 0.4 per cent <strong>of</strong> all couplehouseholds). However this applied only to a small number<strong>of</strong> cases, regardless <strong>of</strong> family type.10 In most cases, this is due to the primary carer changing their partnership status, but in a very small number <strong>of</strong> cases (less than 5 per cent <strong>of</strong> the totalnumber <strong>of</strong> study children) the change in the household type is due to the child having a new primary carer at wave 3.28 Footprints in Time: The Longitudinal Study <strong>of</strong> Indigenous Children | Key <strong>Summary</strong> <strong>Report</strong> from Wave 3

![pdf [107kB] - Department of Families, Housing, Community Services](https://img.yumpu.com/51272499/1/190x245/pdf-107kb-department-of-families-housing-community-services.jpg?quality=85)


![Land Claim - pdf [278kB] - Department of Families, Housing ...](https://img.yumpu.com/47002639/1/184x260/land-claim-pdf-278kb-department-of-families-housing-.jpg?quality=85)

![Borroloola Land Claim - pdf [299kB] - Department of Families ...](https://img.yumpu.com/46103973/1/184x260/borroloola-land-claim-pdf-299kb-department-of-families-.jpg?quality=85)