Summary Report - pdf - Department of Families, Housing ...
Summary Report - pdf - Department of Families, Housing ...
Summary Report - pdf - Department of Families, Housing ...
You also want an ePaper? Increase the reach of your titles
YUMPU automatically turns print PDFs into web optimized ePapers that Google loves.
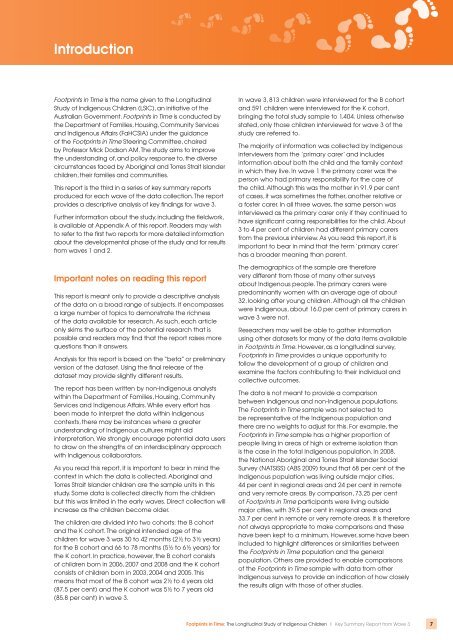
IntroductionFootprints in Time is the name given to the LongitudinalStudy <strong>of</strong> Indigenous Children (LSIC), an initiative <strong>of</strong> theAustralian Government. Footprints in Time is conducted bythe <strong>Department</strong> <strong>of</strong> <strong>Families</strong>, <strong>Housing</strong>, Community Servicesand Indigenous Affairs (FaHCSIA) under the guidance<strong>of</strong> the Footprints in Time Steering Committee, chairedby Pr<strong>of</strong>essor Mick Dodson AM. The study aims to improvethe understanding <strong>of</strong>, and policy response to, the diversecircumstances faced by Aboriginal and Torres Strait Islanderchildren, their families and communities.This report is the third in a series <strong>of</strong> key summary reportsproduced for each wave <strong>of</strong> the data collection. The reportprovides a descriptive analysis <strong>of</strong> key findings for wave 3.Further information about the study, including the fieldwork,is available at Appendix A <strong>of</strong> this report. Readers may wishto refer to the first two reports for more detailed informationabout the developmental phase <strong>of</strong> the study and for resultsfrom waves 1 and 2.Important notes on reading this reportThis report is meant only to provide a descriptive analysis<strong>of</strong> the data on a broad range <strong>of</strong> subjects. It encompassesa large number <strong>of</strong> topics to demonstrate the richness<strong>of</strong> the data available for research. As such, each articleonly skims the surface <strong>of</strong> the potential research that ispossible and readers may find that the report raises morequestions than it answers.Analysis for this report is based on the “beta” or preliminaryversion <strong>of</strong> the dataset. Using the final release <strong>of</strong> thedataset may provide slightly different results.The report has been written by non-Indigenous analystswithin the <strong>Department</strong> <strong>of</strong> <strong>Families</strong>, <strong>Housing</strong>, CommunityServices and Indigenous Affairs. While every effort hasbeen made to interpret the data within Indigenouscontexts, there may be instances where a greaterunderstanding <strong>of</strong> Indigenous cultures might aidinterpretation. We strongly encourage potential data usersto draw on the strengths <strong>of</strong> an interdisciplinary approachwith Indigenous collaborators.As you read this report, it is important to bear in mind thecontext in which the data is collected. Aboriginal andTorres Strait Islander children are the sample units in thisstudy. Some data is collected directly from the childrenbut this was limited in the early waves. Direct collection willincrease as the children become older.The children are divided into two cohorts: the B cohortand the K cohort. The original intended age <strong>of</strong> thechildren for wave 3 was 30 to 42 months (2½ to 3½ years)for the B cohort and 66 to 78 months (5½ to 6½ years) forthe K cohort. In practice, however, the B cohort consists<strong>of</strong> children born in 2006, 2007 and 2008 and the K cohortconsists <strong>of</strong> children born in 2003, 2004 and 2005. Thismeans that most <strong>of</strong> the B cohort was 2½ to 4 years old(87.5 per cent) and the K cohort was 5½ to 7 years old(85.8 per cent) in wave 3.In wave 3, 813 children were interviewed for the B cohortand 591 children were interviewed for the K cohort,bringing the total study sample to 1,404. Unless otherwisestated, only those children interviewed for wave 3 <strong>of</strong> thestudy are referred to.The majority <strong>of</strong> information was collected by Indigenousinterviewers from the ’primary carer’ and includesinformation about both the child and the family contextin which they live. In wave 1 the primary carer was theperson who had primary responsibility for the care <strong>of</strong>the child. Although this was the mother in 91.9 per cent<strong>of</strong> cases, it was sometimes the father, another relative ora foster carer. In all three waves, the same person wasinterviewed as the primary carer only if they continued tohave significant caring responsibilities for the child. About3 to 4 per cent <strong>of</strong> children had different primary carersfrom the previous interview. As you read this report, it isimportant to bear in mind that the term ‘primary carer’has a broader meaning than parent.The demographics <strong>of</strong> the sample are thereforevery different from those <strong>of</strong> many other surveysabout Indigenous people. The primary carers werepredominantly women with an average age <strong>of</strong> about32, looking after young children. Although all the childrenwere Indigenous, about 16.0 per cent <strong>of</strong> primary carers inwave 3 were not.Researchers may well be able to gather informationusing other datasets for many <strong>of</strong> the data items availablein Footprints in Time. However, as a longitudinal survey,Footprints in Time provides a unique opportunity t<strong>of</strong>ollow the development <strong>of</strong> a group <strong>of</strong> children andexamine the factors contributing to their individual andcollective outcomes.The data is not meant to provide a comparisonbetween Indigenous and non-Indigenous populations.The Footprints in Time sample was not selected tobe representative <strong>of</strong> the Indigenous population andthere are no weights to adjust for this. For example, theFootprints in Time sample has a higher proportion <strong>of</strong>people living in areas <strong>of</strong> high or extreme isolation thanis the case in the total Indigenous population. In 2008,the National Aboriginal and Torres Strait Islander SocialSurvey (NATSISS) (ABS 2009) found that 68 per cent <strong>of</strong> theIndigenous population was living outside major cities,44 per cent in regional areas and 24 per cent in remoteand very remote areas. By comparison, 73.25 per cent<strong>of</strong> Footprints in Time participants were living outsidemajor cities, with 39.5 per cent in regional areas and33.7 per cent in remote or very remote areas. It is thereforenot always appropriate to make comparisons and thesehave been kept to a minimum. However, some have beenincluded to highlight differences or similarities betweenthe Footprints in Time population and the generalpopulation. Others are provided to enable comparisons<strong>of</strong> the Footprints in Time sample with data from otherIndigenous surveys to provide an indication <strong>of</strong> how closelythe results align with those <strong>of</strong> other studies.Footprints in Time: The Longitudinal Study <strong>of</strong> Indigenous Children | Key <strong>Summary</strong> <strong>Report</strong> from Wave 37



![pdf [107kB] - Department of Families, Housing, Community Services](https://img.yumpu.com/51272499/1/190x245/pdf-107kb-department-of-families-housing-community-services.jpg?quality=85)


![Land Claim - pdf [278kB] - Department of Families, Housing ...](https://img.yumpu.com/47002639/1/184x260/land-claim-pdf-278kb-department-of-families-housing-.jpg?quality=85)
![Borroloola Land Claim - pdf [299kB] - Department of Families ...](https://img.yumpu.com/46103973/1/184x260/borroloola-land-claim-pdf-299kb-department-of-families-.jpg?quality=85)