

Summary Report - pdf - Department of Families, Housing ...
Summary Report - pdf - Department of Families, Housing ...
Summary Report - pdf - Department of Families, Housing ...

You also want an ePaper? Increase the reach of your titles
YUMPU automatically turns print PDFs into web optimized ePapers that Google loves.
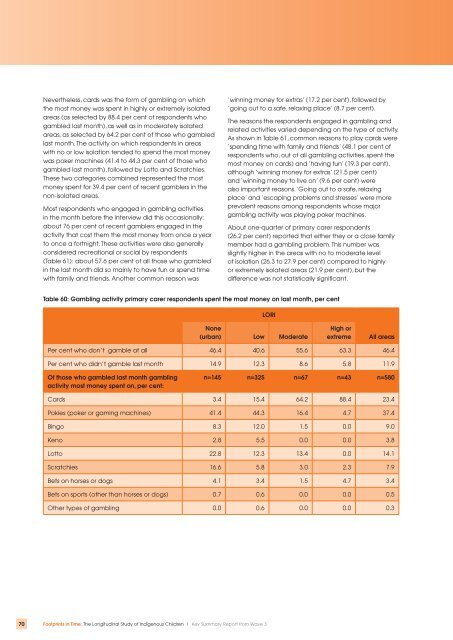
Nevertheless, cards was the form <strong>of</strong> gambling on whichthe most money was spent in highly or extremely isolatedareas (as selected by 88.4 per cent <strong>of</strong> respondents whogambled last month), as well as in moderately isolatedareas, as selected by 64.2 per cent <strong>of</strong> those who gambledlast month. The activity on which respondents in areaswith no or low isolation tended to spend the most moneywas poker machines (41.4 to 44.3 per cent <strong>of</strong> those whogambled last month), followed by Lotto and Scratchies.These two categories combined represented the mostmoney spent for 39.4 per cent <strong>of</strong> recent gamblers in thenon-isolated areas.Most respondents who engaged in gambling activitiesin the month before the interview did this occasionally:about 76 per cent <strong>of</strong> recent gamblers engaged in theactivity that cost them the most money from once a yearto once a fortnight. These activities were also generallyconsidered recreational or social by respondents(Table 61): about 57.6 per cent <strong>of</strong> all those who gambledin the last month did so mainly to have fun or spend timewith family and friends. Another common reason was‘winning money for extras’ (17.2 per cent), followed by‘going out to a safe, relaxing place’ (8.7 per cent).The reasons the respondents engaged in gambling andrelated activities varied depending on the type <strong>of</strong> activity.As shown in Table 61, common reasons to play cards were‘spending time with family and friends’ (48.1 per cent <strong>of</strong>respondents who, out <strong>of</strong> all gambling activities, spent themost money on cards) and ‘having fun’ (19.3 per cent),although ‘winning money for extras’ (21.5 per cent)and ‘winning money to live on’ (9.6 per cent) werealso important reasons. ‘Going out to a safe, relaxingplace’ and ‘escaping problems and stresses’ were moreprevalent reasons among respondents whose majorgambling activity was playing poker machines.About one-quarter <strong>of</strong> primary carer respondents(26.2 per cent) reported that either they or a close familymember had a gambling problem. This number wasslightly higher in the areas with no to moderate level<strong>of</strong> isolation (26.3 to 27.9 per cent) compared to highlyor extremely isolated areas (21.9 per cent), but thedifference was not statistically significant.Table 60: Gambling activity primary carer respondents spent the most money on last month, per centLORINone(urban) Low ModerateHigh orextremeAll areasPer cent who don’t gamble at all 46.4 40.6 55.6 63.3 46.4Per cent who didn’t gamble last month 14.9 12.3 8.6 5.8 11.9Of those who gambled last month gamblingactivity most money spent on, per cent:n=145 n=325 n=67 n=43 n=580Cards 3.4 15.4 64.2 88.4 23.4Pokies (poker or gaming machines) 41.4 44.3 16.4 4.7 37.4Bingo 8.3 12.0 1.5 0.0 9.0Keno 2.8 5.5 0.0 0.0 3.8Lotto 22.8 12.3 13.4 0.0 14.1Scratchies 16.6 5.8 3.0 2.3 7.9Bets on horses or dogs 4.1 3.4 1.5 4.7 3.4Bets on sports (other than horses or dogs) 0.7 0.6 0.0 0.0 0.5Other types <strong>of</strong> gambling 0.0 0.6 0.0 0.0 0.370 Footprints in Time: The Longitudinal Study <strong>of</strong> Indigenous Children | Key <strong>Summary</strong> <strong>Report</strong> from Wave 3

![pdf [107kB] - Department of Families, Housing, Community Services](https://img.yumpu.com/51272499/1/190x245/pdf-107kb-department-of-families-housing-community-services.jpg?quality=85)


![Land Claim - pdf [278kB] - Department of Families, Housing ...](https://img.yumpu.com/47002639/1/184x260/land-claim-pdf-278kb-department-of-families-housing-.jpg?quality=85)

![Borroloola Land Claim - pdf [299kB] - Department of Families ...](https://img.yumpu.com/46103973/1/184x260/borroloola-land-claim-pdf-299kb-department-of-families-.jpg?quality=85)