

Summary Report - pdf - Department of Families, Housing ...
Summary Report - pdf - Department of Families, Housing ...
Summary Report - pdf - Department of Families, Housing ...

Create successful ePaper yourself
Turn your PDF publications into a flip-book with our unique Google optimized e-Paper software.
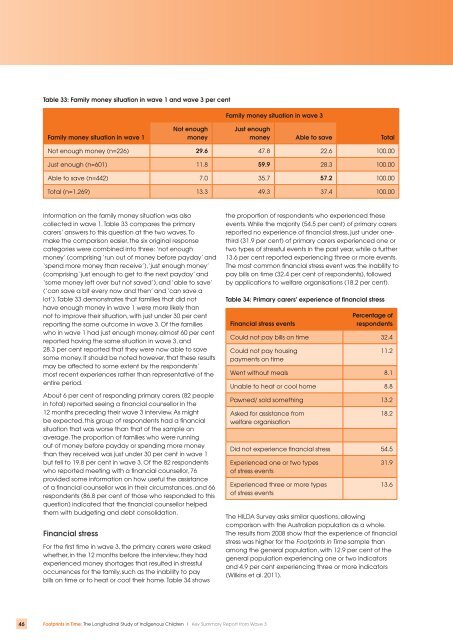
Table 33: Family money situation in wave 1 and wave 3 per centFamily money situation in wave 3Family money situation in wave 1Not enoughmoneyJust enoughmoney Able to save TotalNot enough money (n=226) 29.6 47.8 22.6 100.00Just enough (n=601) 11.8 59.9 28.3 100.00Able to save (n=442) 7.0 35.7 57.2 100.00Total (n=1,269) 13.3 49.3 37.4 100.00Information on the family money situation was alsocollected in wave 1. Table 33 compares the primarycarers’ answers to this question at the two waves. Tomake the comparison easier, the six original responsecategories were combined into three: ‘not enoughmoney’ (comprising ‘run out <strong>of</strong> money before payday’ and‘spend more money than receive’), ‘just enough money’(comprising ‘just enough to get to the next payday’ and‘some money left over but not saved’), and ‘able to save’(‘can save a bit every now and then’ and ‘can save alot’). Table 33 demonstrates that families that did nothave enough money in wave 1 were more likely thannot to improve their situation, with just under 30 per centreporting the same outcome in wave 3. Of the familieswho in wave 1 had just enough money, almost 60 per centreported having the same situation in wave 3, and28.3 per cent reported that they were now able to savesome money. It should be noted however, that these resultsmay be affected to some extent by the respondents’most recent experiences rather than representative <strong>of</strong> theentire period.About 6 per cent <strong>of</strong> responding primary carers (82 peoplein total) reported seeing a financial counsellor in the12 months preceding their wave 3 interview. As mightbe expected, this group <strong>of</strong> respondents had a financialsituation that was worse than that <strong>of</strong> the sample onaverage. The proportion <strong>of</strong> families who were runningout <strong>of</strong> money before payday or spending more moneythan they received was just under 30 per cent in wave 1but fell to 19.8 per cent in wave 3. Of the 82 respondentswho reported meeting with a financial counsellor, 76provided some information on how useful the assistance<strong>of</strong> a financial counsellor was in their circumstances, and 66respondents (86.8 per cent <strong>of</strong> those who responded to thisquestion) indicated that the financial counsellor helpedthem with budgeting and debt consolidation.Financial stressFor the first time in wave 3, the primary carers were askedwhether, in the 12 months before the interview, they hadexperienced money shortages that resulted in stressfuloccurrences for the family, such as the inability to paybills on time or to heat or cool their home. Table 34 showsthe proportion <strong>of</strong> respondents who experienced theseevents. While the majority (54.5 per cent) <strong>of</strong> primary carersreported no experience <strong>of</strong> financial stress, just under onethird(31.9 per cent) <strong>of</strong> primary carers experienced one ortwo types <strong>of</strong> stressful events in the past year, while a further13.6 per cent reported experiencing three or more events.The most common financial stress event was the inability topay bills on time (32.4 per cent <strong>of</strong> respondents), followedby applications to welfare organisations (18.2 per cent).Table 34: Primary carers’ experience <strong>of</strong> financial stressFinancial stress eventsPercentage <strong>of</strong>respondentsCould not pay bills on time 32.4Could not pay housingpayments on time11.2Went without meals 8.1Unable to heat or cool home 8.8Pawned/ sold something 13.2Asked for assistance fromwelfare organisation18.2Did not experience financial stress 54.5Experienced one or two types<strong>of</strong> stress eventsExperienced three or more types<strong>of</strong> stress events31.913.6The HILDA Survey asks similar questions, allowingcomparison with the Australian population as a whole.The results from 2008 show that the experience <strong>of</strong> financialstress was higher for the Footprints in Time sample thanamong the general population, with 12.9 per cent <strong>of</strong> thegeneral population experiencing one or two indicatorsand 4.9 per cent experiencing three or more indicators(Wilkins et al. 2011).46 Footprints in Time: The Longitudinal Study <strong>of</strong> Indigenous Children | Key <strong>Summary</strong> <strong>Report</strong> from Wave 3

![pdf [107kB] - Department of Families, Housing, Community Services](https://img.yumpu.com/51272499/1/190x245/pdf-107kb-department-of-families-housing-community-services.jpg?quality=85)


![Land Claim - pdf [278kB] - Department of Families, Housing ...](https://img.yumpu.com/47002639/1/184x260/land-claim-pdf-278kb-department-of-families-housing-.jpg?quality=85)

![Borroloola Land Claim - pdf [299kB] - Department of Families ...](https://img.yumpu.com/46103973/1/184x260/borroloola-land-claim-pdf-299kb-department-of-families-.jpg?quality=85)