Untitled - PRIME Gold
Untitled - PRIME Gold
Untitled - PRIME Gold
- No tags were found...
Create successful ePaper yourself
Turn your PDF publications into a flip-book with our unique Google optimized e-Paper software.
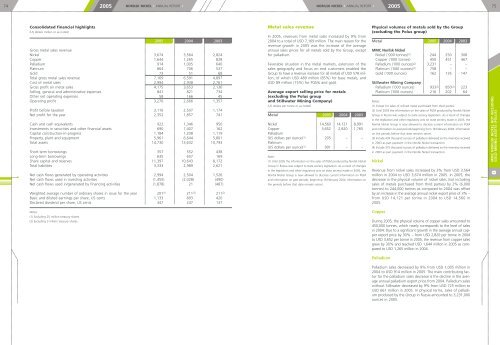
74 2005 NORILSK NICKEL • ANNUAL REPORT •NORILSK NICKEL • ANNUAL REPORT •200575Consolidated financial highlights(US dollars million or as noted)2005 2004 2003Gross metal sales revenueNickel 3,674 3,564 2,824Copper 1,644 1,265 828Palladium 914 1,005 640Platinum 864 706 537<strong>Gold</strong> 73 51 68Total gross metal sales revenue 7,169 6,591 4,897Cost of metal sales 2,994 2,938 2,761Gross profit on metal sales 4,175 3,653 2,136Selling, general and administrative expenses 841 821 734Other net operating expenses 58 166 45Operating profit 3,276 2,666 1,357Profit before taxation 3,116 2,507 1,174Net profit for the year 2,352 1,857 741Cash and cash equivalents 922 1,346 950Investments in securities and other financial assets 690 1,407 162Capital construction-in-progress 1,184 1,208 1,119Property, plant and equipment 5,961 6,644 5,801Total assets 14,730 13,632 10,793Short-term borrowings 357 552 438Long-term borrowings 635 657 169Share capital and reserves 11,397 10,643 8,172Total liabilities 3,333 2,989 2,621Net cash flows generated by operating activities 2,994 2,504 1,526Net cash flows used in investing activities (1,455) (2,028) (490)Net cash flows used in/generated by financing activities (1,878) 21 (487)Weighted average number of ordinary shares in issue for the year 201 (1) 211 (2) 211 (2)Basic and diluted earnings per share, US cents 1,133 893 420Declared dividend per share, US cents 347 247 137Metal sales revenueIn 2005, revenues from metal sales increased by 9% from2004 to a total of USD 7,169 million. The main reason for therevenue growth in 2005 was the increase of the averageannual sales prices for all metals sold by the Group, exceptfor palladium.Favorable situation in the metal markets, extension of thesales geography and focus on end customers enabled theGroup to have a revenue increase for all metals of USD 578 million,of which USD 489 million (85%) for base metals, andUSD 89 million (15%) for PGMs and gold.Average export selling price for metals(excluding the Polus groupand Stillwater Mining Company)(US dollars per tonne or as noted)Metal 2005 2004 2003Nickel 14,560 14,121 8,991Copper 3,652 2,820 1,765Palladium(US dollars per ounce) (1) 205 – –Platinum(US dollars per ounce) (1) 901 – –Note:(1) Until 2005 the information on the sales of PGM produced by Norilsk NickelGroup in Russia was subject to state secrecy legislation. As a result of changesin the legislation and other regulatory acts on state secrecy made in 2005, theNorilsk Nickel Group is now allowed to disclose current information on PGMand information on past periods, beginning 18 February 2004. Information onthe periods before that date remains secret.Physical volumes of metals sold by the Group(excluding the Polus group)Metal 2005 2004 2003MMC Norilsk NickelNickel ('000 tonnes) (1) 244 250 308Copper ('000 tonnes) 450 451 467Palladium ('000 ounces) (2) 3,231 – –Platinum ('000 ounces) (2) 758 – –<strong>Gold</strong> ('000 ounces) 162 135 147Stillwater Mining CompanyPalladium ('000 ounces) 933 (3) 850 (4) 223Platinum ('000 ounces) 216 202 64Notes:(1) Except for sales of refined metal purchased from third parties.(2) Until 2005 the information on the sales of PGM produced by Norilsk NickelGroup in Russia was subject to state secrecy legislation. As a result of changesin the legislation and other regulatory acts on state secrecy made in 2005, theNorilsk Nickel Group is now allowed to disclose current information on PGMand information on past periods beginning from 18 February 2004. Informationon the periods before that date remains secret.(3) Include 439 thousand ounces of palladium delivered ex the inventory receivedin 2003 as part payment in the Norilsk Nickel transaction.(4) Include 375 thousand ounces of palladium delivered ex the inventory receivedin 2003 as part payment in the Norilsk Nickel transaction.NickelRevenue from nickel sales increased by 3% from USD 3,564million in 2004 to USD 3,674 million in 2005. In 2005, thedecrease in the physical volume of nickel sales (not includingsales of metals purchased from third parties) by 2% (6,000tonnes) to 244,000 tonnes as compared to 2004 was offsetby an increase in the average annual nickel export price of 3% –from USD 14,121 per tonne in 2004 to USD 14,560 in2005.MMC NORILSK NICKEL NOT INCLUDINGGOLD MINING ASSETS (POLUS)8Notes:(1) Excluding 25 million treasury shares.(2) Excluding 3 million treasury shares.CopperDuring 2005, the physical volume of copper sales amounted to450,000 tonnes, which nearly corresponds to the level of salesin 2004. Due to a significant growth in the average annual copperexport price by 30% – from USD 2,820 per tonne in 2004to USD 3,652 per tonne in 2005, the revenue from copper salesgrew by 30% and reached USD 1,644 million in 2005 as comparedto USD 1,265 million in 2004.PalladiumPalladium sales decreased by 9% from USD 1,005 million in2004 to USD 914 million in 2005. The main contributing factorfor the palladium sales decrease is the decline in the averageannual palladium export price from 2004. Palladium saleswithout Stillwater decreased by 9% from USD 725 million toUSD 661 million in 2005. In physical terms, sales of palladiumproduced by the Group in Russia amounted to 3,231,000ounces in 2005.


