Untitled - PRIME Gold
Untitled - PRIME Gold
Untitled - PRIME Gold
- No tags were found...
Create successful ePaper yourself
Turn your PDF publications into a flip-book with our unique Google optimized e-Paper software.
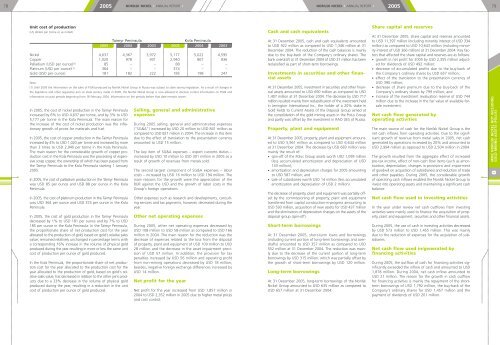
78 2005 NORILSK NICKEL • ANNUAL REPORT •NORILSK NICKEL • ANNUAL REPORT •200579Unit cost of production(US dollars per tonne or as noted)Taimyr PeninsulaKola Peninsula2005 2004 2003 2005 2004 2003Nickel 4,637 4,367 3,972 5,177 5,022 4,595Copper 1,020 978 931 2,940 867 836Palladium (USD per ounce) (1) 85 – – 88 – –Platinum (USD per ounce) (1) 364 – – 374 – –<strong>Gold</strong> (USD per ounce) 181 182 222 185 198 247Note:(1) Until 2005 the information on the sales of PGM produced by Norilsk Nickel Group in Russia was subject to state secrecy legislation. As a result of changes inthe legislation and other regulatory acts on state secrecy made in 2005, the Norilsk Nickel Group is now allowed to disclose current information on PGM andinformation on past periods beginning from 18 February 2004. Information on the periods before that date remains secret.In 2005, the cost of nickel production in the Taimyr Peninsulaincreased by 6% to USD 4,637 per tonne, and by 3% to USD5,177 per tonne in the Kola Peninsula. The main reason forthe increase of the cost of nickel production was the inflationarygrowth of prices for materials and fuel.In 2005, the cost of copper production in the Taimyr Peninsulaincreased by 4% to USD 1,020 per tonne and increased by morethan 3 times to USD 2,940 per tonne in the Kola Peninsula.The main reason for the considerable growth of copper productioncost in the Kola Peninsula was the processing of expensivescrap copper, the ownership of which has been passed fromthe Taimyr Peninsula to the Kola Peninsula starting 1 January2005.In 2005, the cost of palladium production in the Taimyr Peninsulawas USD 85 per ounce and USD 88 per ounce in the KolaPeninsula.In 2005, the cost of platinum production in the Taimyr Peninsulawas USD 364 per ounce and USD 374 per ounce in the KolaPeninsula.In 2005, the cost of gold production in the Taimyr Peninsuladecreased by 1% to USD 181 per ounce and by 7% to USD185 per ounce in the Kola Peninsula. In the Taimyr Peninsula,the proportionate share of net production cost for the yearallocated to the production of gold, based on gold's relative salesvalue, remained relatively unchanged in percentage terms witha corresponding 16% increase in the volume of physical goldproduced during the year resulting in more or less the same unitcost of production per ounce of gold produced.In the Kola Peninsula, the proportionate share of net productioncost for the year allocated to the production cost for theyear allocated to the production of gold, based on gold's relativesales value, has decreased in relation to the other joint productsdue to a 33% decrease in the volume of physical goldproduced during the year, resulting in a reduction in the unitcost of production per ounce of gold produced.Selling, general and administrativeexpensesDuring 2005 selling, general and administrative expenses("SG&A") increased by USD 20 million to USD 841 million ascompared to USD 821 million in 2004. The increase in this itemdue to the effect of translation to the presentation currencyamounted to USD 15 million.The key item of SG&A expenses – export customs duties –increased by USD 10 million to USD 301 million in 2005 as aresult of growth of revenues from metals sold.The second largest component of SG&A expenses – laborcosts – increased by USD 16 million to USD 194 million. Themain reasons for the growth were the appreciation of theRUR against the USD and the growth of labor costs in theGroup's foreign operations.Other expenses such as research and developments, consultingservices and tax payments, however, decreased during theyear.Other net operating expensesDuring 2005, other net operating expenses decreased byUSD 108 million to USD 58 million as compared to USD 166million in 2004. The main reason for the reduction was thedecrease of expenses related to the loss from the disposalof property, plant and equipment of USD 109 million to USD28 million and the decrease in the asset impairment provisionof USD 57 million. In addition, the provision for taxpenalties increased by USD 56 million and operating profitfrom non-mining operations decreased by USD 18 million;besides, negative foreign exchange differences increased byUSD 14 million.Net profit for the yearNet profit for the year increased from USD 1,857 million in2004 to USD 2,352 million in 2005 due to higher metal pricesand cost control.Cash and cash equivalentsAt 31 December 2005, cash and cash equivalents amountedto USD 922 million as compared to USD 1,346 million at 31December 2004. The reduction of the cash balances is mainlydue to the buy-back of the Company's ordinary shares. Thebank overdraft at 31 December 2004 of USD 21 million has beenreclassified as part of short-term borrowings.Investments in securities and other financialassetsAt 31 December 2005, investment in securities and other financialassets amounted to USD 690 million as compared to USD1,407 million at 31 December 2004. The decrease by USD 717million resulted mainly from reclassification of the investment heldin Jenington International Inc., the holder of a 20% stake in<strong>Gold</strong> Fields to Current Assets of the Disposal Group aimed atthe consolidation of the gold mining assets in the Polus Groupand partly was offset by the investment in RAO UES of Russia.Property, plant and equipmentAt 31 December 2005, property, plant and equipment amountedto USD 5,961 million as compared to USD 6,644 millionat 31 December 2004. The decrease by USD 683 million wasmainly the result of:• spin-off of the Polus Group assets worth USD 1,099 million(less accumulated amortization and depreciation of USD133 million);• amortization and depreciation charges for 2005 amountingto USD 587 million; and• sale of subsidiaries worth USD 14 million (less accumulatedamortization and depreciation of USD 2 million).The decrease of property, plant and equipment was partially offsetby the commissioning of property, plant and equipmenttransferred from capital construction-in-progress amounting toUSD 593 million, acquisition of new assets for USD 437 millionand the elimination of depreciation charges on the assets of thedisposal group (spin-off).Short-term borrowingsAt 31 December 2005, short-term loans and borrowings(including current portion of long-term borrowings and overdrafts)amounted to USD 357 million as compared to USD552 million at 31 December 2004. The reduction was mainlydue to the decrease of the current portion of long-termborrowings by USD 315 million, which was partially offset bythe growth of short-term borrowings by USD 120 million.Long-term borrowingsAt 31 December 2005, long-term borrowings of the NorilskNickel Group amounted to USD 635 million as compared toUSD 657 million at 31 December 2004.Share capital and reservesAt 31 December 2005, share capital and reserves amountedto USD 11,397 million (including minority interest of USD 334million) as compared to USD 10,643 million (including minorityinterest of USD 366 million) at 31 December 2004. Key factorsthat affected the share capital and reserves are as follows:• growth in net profit for 2005 by USD 2,355 million adjustedfor dividends of USD 492 million;• decrease of accumulated profits due to the buy-back ofthe Company's ordinary shares by USD 657 million;• effect of the translation to the presentation currency ofUSD 390 million;• decrease of share premium due to the buy-back of theCompany's ordinary shares by 799 million; and• increase of the investment revaluation reserve of USD 744million due to the increase in the fair value of available-forsaleinvestment.Net cash flow generated byoperating activitiesThe main source of cash for the Norilsk Nickel Group is thenet cash inflows from operating activities. Due to the significantgrowth of revenue from metal sales in 2005, net cashgenerated by operations increased by 20% and amounted toUSD 2,994 million as opposed to USD 2,504 million in 2004.The growth resulted from the aggregate effect of increasedpre-tax income, effect of non-cash flow items (such as amortization,depreciation, changes in provisions and impairmentof goodwill on acquisition of subsidiaries) and reduction of tradeand other payables. During 2005, the considerable growthof operating cash inflows enabled the Norilsk Nickel Group toinvest into operating assets and maintaining a significant cashbalance.Net cash flow used in investing activitiesIn the year under review net cash outflows from investingactivities were mainly used to finance the acquisition of property,plant and equipment, securities and other financial assets.During 2005, the use of cash in investing activities decreasedby USD 573 million to USD 1,455 million. This was mainlydue to the reduction of expenses for the acquisition of subsidiaries.Net cash flow used in/generated byfinancing activitiesDuring 2005, the outflow of cash for financing activities significantlyexceeded the inflow of cash and amounted to USD1,878 million. During 2004, net cash inflow amounted toUSD 21 million. The reason for the growth in cash outflowfor financing activities is mainly the repayment of the shorttermborrowings of USD 1,792 million, the buy-back of theCompany's ordinary shares for USD 1,457 million and thepayment of dividends of USD 201 million.MMC NORILSK NICKEL NOT INCLUDINGGOLD MINING ASSETS (POLUS)8


