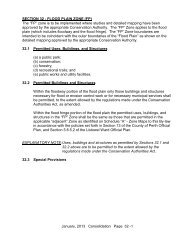
5.3 Strong Future <strong>Economic</strong> Driver: Value Added Agriculture <strong>and</strong> Agri-FoodThis sub-section examines the region`s agricultural products <strong>and</strong> value added opportunities by examiningsector employment & labour force, business establishments <strong>and</strong> occupations.The Agriculture, Value Added Agriculture <strong>and</strong> Agri-Food Sector provides 5,535 jobs <strong>and</strong> employs 5,340residents in the region. This region is a net importer of 195 agriculture-related jobs. Many of the jobs areon farms (3,775) <strong>and</strong> in food manufacturing (1,610).In the local agricultural industry, there are generally two types of operators:• Large farm operators with several hundred head of animals or acres of crops <strong>and</strong> contracts withintermediaries or with large processing facilities.• Mid-sized <strong>and</strong> small farm operators who may provide more value added agricultural products.In the industry as a whole, food processors are recognizing the value of consumer diversity <strong>and</strong> providingmore ethnic, organic <strong>and</strong> artisanal food. It is estimated that the specialty food sector has been growing by9% annually <strong>and</strong> expected to rise to 12% in the next five years. 10 Reacting to this trend are the local midsized<strong>and</strong> small farm operators. Locally, there has been growth in the number of entrepreneurial firmsserving unique specialty markets – largely made possible by the region’s proximity to a large populationbase in the Greater Golden Horseshoe <strong>and</strong> their growing immigrant communities.The region has an employment <strong>and</strong> labour force concentration in food manufacturing. Specifically, jobsare highest in fruit <strong>and</strong> vegetable preserving (455) <strong>and</strong> animal food manufacturing (440) (Figure 19). Withthe closure of the Campbell’s Soup Manufacturing plant in Listowel, the jobs in fruit <strong>and</strong> vegetablepreserving are expected to have declined substantially. The recent announcement of Erie Meats usingthis processing space for meat product manufacturing will increase the number of jobs in this industry.Figure 19 – Food Manufacturing Industry, 20060 200 400 600 800 1,000 1,200 1,400 1,600 1,800Jobs455440285200155Resident Labour Force2253852502151453114 Fruit <strong>and</strong> vegetable preserving <strong>and</strong> specialty food manufacturing3111 Animal food manufacturing3116 Meat product manufacturing3115 Dairy product manufacturing3119 Other food manufacturingSource: Statistics Canada, REDDI Tool: Labour Flow Analysis, 2006.10`Donald, Betsy, (2009). `From Kraft to Craft: Innovation <strong>and</strong> creativity in Ontario`s Food economy.` Martin Prosperity Institute.<strong>Perth</strong>, St. Marys <strong>and</strong> Stratford <strong>Economic</strong> <strong>Development</strong> <strong>Strategy</strong> <strong>and</strong> <strong>Action</strong> <strong>Plan</strong> 48 | P age
Business EstablishmentsBased on the region`s unique climate <strong>and</strong> growing conditions, stakeholders have addressed an interest inpursuing the attraction of more agri-food producers, by capitalizing on the local success of the agriculturalindustry. There is diversity in the industry, as the results in the following table confirm. The largestnumber of farms are being used for dairy cattle <strong>and</strong> milk production (431), hog <strong>and</strong> pig farming (379),other grain farming that excludes soybeans, corn or wheat (329) <strong>and</strong> beef cattle ranching <strong>and</strong> farming(319). These results suggest there are opportunities to embark on value-added operations such as theproduction of specialty foods <strong>and</strong> biofibres.Figure 20 – Farming Type, Region <strong>and</strong> Ontario, 2006WesternProject OntarioRegion Region OntarioTotal farms 2,438 18,498 57,211Dairy cattle <strong>and</strong> milk production 431 1,849 4,937Hog <strong>and</strong> pig farming 379 1,274 2,222Other grain farming 329 1,617 4,420Beef cattle ranching <strong>and</strong> farming, includingfeedlots 319 4,535 11,052Soybean farming 227 1,135 5,812Corn farming 126 425 1,694Livestock combination farming 93 1,002 2,464Horse <strong>and</strong> other equine production 88 1,455 4,297Hay farming 77 1,447 5,917Broiler <strong>and</strong> other meat-type chicken production 59 378 834Wheat farming 59 280 953Chicken egg production 50 227 599All other miscellaneous crop farming 48 600 2,179Sheep farming 30 417 1,021Other vegetables (except potato) <strong>and</strong> melonfarming 24 279 1,526Goat farming 23 131 344Dry pea <strong>and</strong> bean farming 16 58 152Floriculture production 11 177 968Fur-bearing animal <strong>and</strong> rabbit production 10 57 112Nursery <strong>and</strong> tree production 9 411 1,474Fruit <strong>and</strong> tree-nut farming 6 275 1,892Note: Farm types of five or fewer were not included in the sector summary.Source: Statistics Canada, Census of Agriculture, 2006.The top five highest concentrations of farms are:• Hog <strong>and</strong> pig farming (LQ 2.26)• Corn farming (LQ 2.25)• Dry pea <strong>and</strong> bean farming (LQ 2.09)• Dairy cattle <strong>and</strong> milk production (LQ 1.77)• Chicken egg production (LQ 1.67).These high concentrations suggest a potential to further develop <strong>and</strong> grow value-added agriculturalprocessing operations in the region. In particular, the high concentration of hog <strong>and</strong> pig farming suggests<strong>Perth</strong>, St. Marys <strong>and</strong> Stratford <strong>Economic</strong> <strong>Development</strong> <strong>Strategy</strong> <strong>and</strong> <strong>Action</strong> <strong>Plan</strong> 49 | P age
- Page 1 and 2: Final ReportCounty of Perth, Town o
- Page 3 and 4: List of FiguresFigure 1 - Location
- Page 5 and 6: 1 Introduction1.1 Purpose of the Re
- Page 7 and 8: The Shift-Share analysis then took
- Page 9 and 10: FindingProportionately more people
- Page 11 and 12: 3 Local Situational AnalysisThe Sec
- Page 13 and 14: (compared to Ontario 9.23, compared
- Page 15 and 16: The LQ analysis identified five ind
- Page 17 and 18: There were surprisingly many simila
- Page 19 and 20: important, there was also expressed
- Page 21 and 22: Question 2. What are the major diff
- Page 23 and 24: Question 3. Understanding what thes
- Page 25 and 26: their jobs in manufacturing need to
- Page 27 and 28: Figure 7 - Perth County Available E
- Page 29 and 30: • St. Marys water tower realignin
- Page 31 and 32: are 34 schools that serve youth in
- Page 33 and 34: innovation and commercialization in
- Page 35 and 36: Competitive Disadvantages• Govern
- Page 37 and 38: The traits of the recommended targe
- Page 39 and 40: Based on the labour market analysis
- Page 41 and 42: 5.1 Very Strong Future Economic Dri
- Page 43 and 44: Figure 14 - “No Employee” Busin
- Page 45 and 46: 5.2 Very Strong Future Economic Dri
- Page 47: The UW Press Release states:``The S
- Page 51 and 52: Figure 22 - SWOT for Value Added Ag
- Page 53 and 54: 55 businesses from 48 in 2003. Othe
- Page 55 and 56: While no province has been complete
- Page 57 and 58: done detailed analysis on national
- Page 59 and 60: Although the specialized design, en
- Page 61 and 62: 5.5 Moderate Future Economic Driver
- Page 63 and 64: 5.6 Industry Sector ConvergenceMost
- Page 65 and 66: The figure points to arts, culture
- Page 67 and 68: StrategicCategoryCapacityBuildingBr
- Page 69 and 70: 6.2 Lone Eagles Sector Marketing Pl
- Page 71 and 72: 6.3 Arts, Culture and Tourism Actio
- Page 73 and 74: 6.4 Agriculture and Agri-Food Actio
- Page 75 and 76: 6.5 Green & Technology Based Manufa
- Page 77 and 78: StrategicCategoryRecommended Initia
- Page 79 and 80: Appendix IFocus Group Results and I
- Page 81 and 82: Executive SummaryAttached are meeti
- Page 83 and 84: 1.0 - Vision 2015Looking ahead 5 ye
- Page 85 and 86: 1.3 - Group 2 (Agriculture, Rural D
- Page 87 and 88: 1.5 - Group 3 (Entrepreneurs & Expo
- Page 89 and 90: 1.7 - Group 4 (Manufacturing & Auto
- Page 91 and 92: 1.9 - Group 5 (Alternate Energy)Vot
- Page 93 and 94: 1.11 - Group 6 (Tourism)Voting Resu
- Page 95 and 96: 4. XXX participation in the "new ec
- Page 97 and 98: • Strong healthy downtowns throug
- Page 99 and 100:
3.2 - Group 2 (Agriculture, Rural D
- Page 101 and 102:
3.3 - Group 3 (Entrepreneurs & Expo
- Page 103 and 104:
3.5 - Group 5 (Alternate Energy)Vot
- Page 105 and 106:
Too much brownspaceToo many abandon
- Page 107 and 108:
2 22. NEWCOMERS: improved web sites
- Page 109 and 110:
2 30. BUY LOCAL: relax zoning bylaw
- Page 111 and 112:
2 25. SKILLS: Support and grow TTG
- Page 113 and 114:
4.5 - Group 5 (Alternate Energy)Vot
- Page 115 and 116:
4.6 - Group 6 (Tourism)Note: These
- Page 117 and 118:
AppendicesA - OverviewProject Overv
- Page 119 and 120:
PRIORITY: internal population growt
- Page 121 and 122:
PRIORITY: preserve the Class 1 and
- Page 123 and 124:
4. VISION$: Search for post graduat
- Page 125 and 126:
2. P5: Environmental planning to su
- Page 127 and 128:
4. Create building application plan
- Page 129 and 130:
Councillors and Municipal Managemen
- Page 131 and 132:
Appendix IILabour Market and Econom
- Page 133 and 134:
3. What were the approximate revenu
- Page 135 and 136:
Business Expansion10. What export m
- Page 137 and 138:
18. How do you plan on using the In
- Page 139 and 140:
23. Using a scale of 1 to 5 where 1
- Page 141 and 142:
Current Training Profile29. Does yo
- Page 143 and 144:
35. Please indicate any formal non-
- Page 145 and 146:
Appendix IIIOne-on-One Stakeholder
- Page 147 and 148:
force. More importantly, the boards
- Page 149 and 150:
entrepreneurs by developing busines
- Page 151 and 152:
Appendix IVInstitutional Stakeholde
- Page 153 and 154:
The creative cultural base in Strat
- Page 155 and 156:
8. What kinds of changes would you
- Page 157 and 158:
Appendix VSocial Media Strategy in
- Page 159 and 160:
• According to Socialnomics 19 ,
- Page 161 and 162:
development organizations should be
- Page 163 and 164:
UserVoice helps small businesses to
- Page 165 and 166:
Social Media and Website Best Pract
- Page 167 and 168:
Figure 6: City of Nanaimo WebsiteAl
- Page 169 and 170:
Figure 9: Prince Edward County Webp
- Page 171 and 172:
Figure 11: PEC You Tube PagePEC bel
- Page 173 and 174:
Figure 14: Ely Facebook PageFigure
- Page 175 and 176:
Figure 17: Newfoundland & Labrador
- Page 177 and 178:
The companies listed above have inc
- Page 179 and 180:
Appendix VIBibliographyPerth, St. M