- Page 2:
Chapter 1Introduction and Basic Con
- Page 5 and 6:
4-2 Energy Balance for Closed Syste
- Page 7 and 8:
7-2 The Increase of Entropy Princip
- Page 9 and 10:
Development of Gas TurbinesDeviatio
- Page 11 and 12:
ProblemsChapter 13Gas Mixtures13-1
- Page 13:
17-1 Stagnation Properties17-2 Spee
- Page 16 and 17:
Appendix 2Property Tables and Chart
- Page 18 and 19:
PREFACEBACKGROUNDThermodynamics is
- Page 20 and 21:
Preface | xixcoverage of oblique sh
- Page 22 and 23:
starts with the simplest case and a
- Page 24 and 25:
A CHOICE OF SI ALONE OR SI/ENGLISH
- Page 26 and 27:
Chapter 1INTRODUCTION AND BASIC CON
- Page 28 and 29:
particles to determine the pressure
- Page 30 and 31:
did not find universal acceptance u
- Page 32 and 33:
1 J 1 N # m (1-3)Chapter 1 | 7wher
- Page 34 and 35:
mN kgs 2andlbf 32.174 ftlbm s 2 C
- Page 36 and 37:
devices is best studied by selectin
- Page 38 and 39:
diameter) is much larger than the m
- Page 40 and 41:
A system is called a simple compres
- Page 42 and 43:
time in a periodic manner, and the
- Page 44 and 45:
points on a plane, these two measur
- Page 46 and 47:
We emphasize that the magnitudes of
- Page 48 and 49:
Chapter 1 | 23P gageP vacP atmP atm
- Page 50 and 51:
the pressure difference between poi
- Page 52 and 53:
Chapter 1 | 27Solution The reading
- Page 54 and 55:
Other Pressure Measurement DevicesA
- Page 56 and 57:
Chapter 1 | 31EXAMPLE 1-8Measuring
- Page 58 and 59:
Chapter 1 | 33Performing the integr
- Page 60 and 61: Keep in mind that the solutions you
- Page 62 and 63: Chapter 1 | 37which is an exact mat
- Page 64 and 65: Chapter 1 | 39SUMMARYIn this chapte
- Page 66 and 67: 1-23C What is a steady-flow process
- Page 68 and 69: 60 NP atm = 95 kPam P = 4 kgChapter
- Page 70 and 71: unknown density is poured into one
- Page 72 and 73: 1-96 The average temperature of the
- Page 74 and 75: Chapter 1 | 491-112E Consider a U-t
- Page 76 and 77: Chapter 2ENERGY, ENERGY TRANSFER, A
- Page 78 and 79: Now if asked to name the energy tra
- Page 80 and 81: Some Physical Insight to Internal E
- Page 82 and 83: uranium-235 atom absorbs a neutron
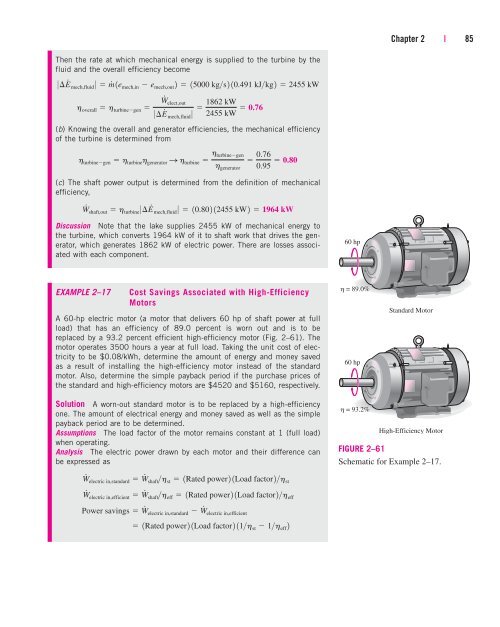
- Page 84 and 85: gz b E # mech m # e mech m # a P
- Page 86 and 87: A process during which there is no
- Page 88 and 89: Heat and work are directional quant
- Page 90 and 91: Chapter 2 | 65Solution A well-insul
- Page 92 and 93: EXAMPLE 2-7Power Transmission by th
- Page 94 and 95: EXAMPLE 2-8Power Needs of a Car to
- Page 96 and 97: erty is the total energy. Note that
- Page 98 and 99: Chapter 2 | 73of a system during a
- Page 100 and 101: E in E out ¢E systemChapter 2
- Page 102 and 103: Chapter 2 | 777 cents per kWh, dete
- Page 104 and 105: all resistance heaters is 100 perce
- Page 106 and 107: the food to the energy consumed by
- Page 108 and 109: converted entirely from one mechani
- Page 112 and 113: usually grouped as hydrocarbons (HC
- Page 114 and 115: Chapter 2 | 89a certain amount of a
- Page 116 and 117: mechanical energy, and thus electri
- Page 118 and 119: Chapter 2 | 93In solids, heat condu
- Page 120 and 121: Chapter 2 | 95In general, both e an
- Page 122 and 123: The energy flow rate associated wit
- Page 124 and 125: 2-23C What is the caloric theory? W
- Page 126 and 127: this escalator. What would your ans
- Page 128 and 129: espectively. If the pressure rise o
- Page 130 and 131: 700 W/m 2 and the surrounding air t
- Page 132 and 133: The water flow rate through the pum
- Page 134: 2-141 The roof of an electrically h
- Page 137 and 138: cen84959_ch03.qxd 4/25/05 2:47 PM P
- Page 139 and 140: cen84959_ch03.qxd 4/1/05 12:31 PM P
- Page 141 and 142: cen84959_ch03.qxd 4/25/05 2:47 PM P
- Page 143 and 144: cen84959_ch03.qxd 4/25/05 2:47 PM P
- Page 145 and 146: cen84959_ch03.qxd 4/1/05 12:31 PM P
- Page 147 and 148: cen84959_ch03.qxd 4/1/05 12:31 PM P
- Page 149 and 150: cen84959_ch03.qxd 4/1/05 12:31 PM P
- Page 151 and 152: cen84959_ch03.qxd 4/25/05 2:47 PM P
- Page 153 and 154: cen84959_ch03.qxd 4/1/05 12:31 PM P
- Page 155 and 156: cen84959_ch03.qxd 4/14/05 4:09 PM P
- Page 157 and 158: cen84959_ch03.qxd 4/11/05 12:23 PM
- Page 159 and 160: cen84959_ch03.qxd 4/1/05 12:31 PM P
- Page 161 and 162:
cen84959_ch03.qxd 4/1/05 12:31 PM P
- Page 163 and 164:
cen84959_ch03.qxd 4/26/05 4:40 PM P
- Page 165 and 166:
cen84959_ch03.qxd 4/1/05 12:31 PM P
- Page 167 and 168:
cen84959_ch03.qxd 4/1/05 12:31 PM P
- Page 169 and 170:
cen84959_ch03.qxd 4/25/05 2:47 PM P
- Page 171 and 172:
cen84959_ch03.qxd 4/19/05 9:40 AM P
- Page 173 and 174:
cen84959_ch03.qxd 4/1/05 12:31 PM P
- Page 175 and 176:
cen84959_ch03.qxd 4/1/05 12:31 PM P
- Page 177 and 178:
cen84959_ch03.qxd 4/11/05 12:23 PM
- Page 179 and 180:
cen84959_ch03.qxd 4/1/05 12:31 PM P
- Page 181 and 182:
cen84959_ch03.qxd 4/1/05 12:31 PM P
- Page 183 and 184:
cen84959_ch03.qxd 4/1/05 12:31 PM P
- Page 185 and 186:
cen84959_ch03.qxd 4/1/05 12:31 PM P
- Page 187 and 188:
cen84959_ch03.qxd 4/1/05 12:31 PM P
- Page 189 and 190:
cen84959_ch03.qxd 4/20/05 5:07 PM P
- Page 191 and 192:
166 | ThermodynamicsThe movingbound
- Page 193 and 194:
168 | Thermodynamicscompression pro
- Page 195 and 196:
170 | ThermodynamicsEXAMPLE 4-3Isot
- Page 197 and 198:
172 | Thermodynamicsthe gas, and (c
- Page 199 and 200:
174 | ThermodynamicsGeneral Q - W =
- Page 201 and 202:
176 | ThermodynamicsUse actual data
- Page 203 and 204:
178 | ThermodynamicsVacuumP = 0W =
- Page 205 and 206:
180 | ThermodynamicsAIRm = 1 kg300
- Page 207 and 208:
182 | ThermodynamicsAIRT, Ku, kJ/kg
- Page 209 and 210:
184 | ThermodynamicsAIR at 300 Kc v
- Page 211 and 212:
186 | ThermodynamicsEXAMPLE 4-9Heat
- Page 213 and 214:
188 | ThermodynamicsP, kPa35023AIRF
- Page 215 and 216:
190 | ThermodynamicsFor solids, the
- Page 217 and 218:
⎫ ⎪⎬⎪⎭⎫⎪⎬⎪⎭192
- Page 219 and 220:
194 | ThermodynamicsA 300-Wrefriger
- Page 221 and 222:
196 | Thermodynamicsdays.) Although
- Page 223 and 224:
198 | ThermodynamicsTABLE 4-3The ra
- Page 225 and 226:
200 | ThermodynamicsSolution A pers
- Page 227 and 228:
202 | Thermodynamics4-7 A piston-cy
- Page 229 and 230:
204 | Thermodynamics4-30 A well-ins
- Page 231 and 232:
206 | Thermodynamics(Table A-2b), a
- Page 233 and 234:
208 | Thermodynamicsa rate of 100 b
- Page 235 and 236:
210 | Thermodynamicsof carbohydrate
- Page 237 and 238:
212 | ThermodynamicsQHePV n = const
- Page 239 and 240:
214 | Thermodynamicsthe entire air
- Page 241 and 242:
216 | Thermodynamics4-149 The speci
- Page 243 and 244:
218 | Thermodynamicsduring vacuum c
- Page 245 and 246:
220 | Thermodynamics2 kgH 216 kgO 2
- Page 247 and 248:
222 | Thermodynamicsm in = 50 kgWat
- Page 249 and 250:
224 | ThermodynamicsIt states that
- Page 251 and 252:
226 | Thermodynamicswhere A jet pD
- Page 253 and 254:
228 | ThermodynamicsThe fluid enter
- Page 255 and 256:
230 | ThermodynamicsFIGURE 5-17Many
- Page 257 and 258:
232 | ThermodynamicsCVW˙eW˙shFIGU
- Page 259 and 260:
234 | ThermodynamicsEXAMPLE 5-4Dece
- Page 261 and 262:
236 | ThermodynamicsDividing by the
- Page 263 and 264:
238 | ThermodynamicsAnalysis We tak
- Page 265 and 266:
240 | Thermodynamicsu 1 = 94.79 kJ/
- Page 267 and 268:
242 | Thermodynamics50°CFluid B70
- Page 269 and 270:
244 | ThermodynamicsR-134a. .Qw,in
- Page 271 and 272:
246 | ThermodynamicsSubstituting th
- Page 273 and 274:
248 | Thermodynamicsone of these wi
- Page 275 and 276:
250 | Thermodynamicssince the initi
- Page 277 and 278:
252 | ThermodynamicsThus,andv 2 0.
- Page 279 and 280:
254 | Thermodynamicsenergy per unit
- Page 281 and 282:
256 | Thermodynamicsunsteady-flow p
- Page 283 and 284:
258 | Thermodynamics5-15 Air enters
- Page 285 and 286:
260 | ThermodynamicsTurbines and Co
- Page 287 and 288:
262 | Thermodynamicsby the incoming
- Page 289 and 290:
264 | Thermodynamicsthe furnace. Ai
- Page 291 and 292:
266 | Thermodynamicsmass flow rate
- Page 293 and 294:
268 | Thermodynamicstank exists in
- Page 295 and 296:
270 | Thermodynamicsis allowed to e
- Page 297 and 298:
272 | Thermodynamicsfind the simple
- Page 299 and 300:
274 | Thermodynamicsenters the buil
- Page 301 and 302:
276 | Thermodynamicsopened, and air
- Page 303 and 304:
278 | Thermodynamics5-212 Refrigera
- Page 305 and 306:
280 | ThermodynamicsHOTCOFFEEHeatFI
- Page 307 and 308:
282 | ThermodynamicsWATERWorkFIGURE
- Page 309 and 310:
284 | ThermodynamicsorIt can also b
- Page 311 and 312:
286 | Thermodynamicsthe cycle, even
- Page 313 and 314:
288 | ThermodynamicsSurrounding med
- Page 315 and 316:
290 | ThermodynamicsFIGURE 6-23When
- Page 317 and 318:
292 | Thermodynamicsheat to the hou
- Page 319 and 320:
294 | ThermodynamicsSystem boundary
- Page 321 and 322:
296 | ThermodynamicsINTERACTIVETUTO
- Page 323 and 324:
298 | Thermodynamics20°CHeat5°C20
- Page 325 and 326:
300 | ThermodynamicsEnergysourceat
- Page 327 and 328:
302 | Thermodynamics1Irrev.HEHigh-t
- Page 329 and 330:
304 | Thermodynamicshave the same e
- Page 331 and 332:
306 | ThermodynamicsHigh-temperatur
- Page 333 and 334:
308 | ThermodynamicsQuantity versus
- Page 335 and 336:
310 | ThermodynamicsWarm environmen
- Page 337 and 338:
312 | ThermodynamicsTABLE 6-1Typica
- Page 339 and 340:
314 | ThermodynamicsCoolairWarmairR
- Page 341 and 342:
316 | Thermodynamicswhere W net,out
- Page 343 and 344:
318 | Thermodynamicsbetween the tem
- Page 345 and 346:
320 | Thermodynamics·120 kPax = 0.
- Page 347 and 348:
322 | ThermodynamicsIf the air surr
- Page 349 and 350:
324 | ThermodynamicsSpecial Topic:
- Page 351 and 352:
326 | Thermodynamics°F temperature
- Page 353 and 354:
328 | Thermodynamics$800 more to in
- Page 355 and 356:
330 | ThermodynamicsIf heat is supp
- Page 357 and 358:
332 | ThermodynamicsReversiblecycli
- Page 359 and 360:
334 | ThermodynamicsT∆S = S 2 - S
- Page 361 and 362:
336 | ThermodynamicsProcess 1-2(rev
- Page 363 and 364:
338 | ThermodynamicsSurroundings∆
- Page 365 and 366:
T340 | ThermodynamicsP 1 s 1 ≅ sT
- Page 367 and 368:
342 | ThermodynamicsEXAMPLE 7-4Entr
- Page 369 and 370:
344 | ThermodynamicsThe power outpu
- Page 371 and 372:
346 | ThermodynamicsTT HT L4A1 2W n
- Page 373 and 374:
348 | ThermodynamicsW shHOT BODY80
- Page 375 and 376:
350 | Thermodynamicsis highly irrev
- Page 377 and 378:
352 | ThermodynamicsEXAMPLE 7-7Effe
- Page 379 and 380:
354 | ThermodynamicsThen the power
- Page 381 and 382:
356 | ThermodynamicsandT 2 P 2s 2
- Page 383 and 384:
358 | ThermodynamicsIsentropic Proc
- Page 385 and 386:
360 | ThermodynamicsThe quantity T/
- Page 387 and 388:
362 | ThermodynamicsT, RT 2 = 780 R
- Page 389 and 390:
364 | ThermodynamicsIn gas power pl
- Page 391 and 392:
366 | ThermodynamicsP 1 , T 1TURBIN
- Page 393 and 394:
368 | ThermodynamicsPP 22Work saved
- Page 395 and 396:
370 | ThermodynamicsThe compressor
- Page 397 and 398:
372 | ThermodynamicsT,°CP 1 = 3 MP
- Page 399 and 400:
374 | ThermodynamicsEXAMPLE 7-15Eff
- Page 401 and 402:
376 | ThermodynamicsT, KP 1 = 200 k
- Page 403 and 404:
378 | ThermodynamicsEntropy Change
- Page 405 and 406:
380 | ThermodynamicsS inMassHeatSys
- Page 407 and 408:
382 | Thermodynamicsor, in the rate
- Page 409 and 410:
384 | ThermodynamicsT,°C4501Thrott
- Page 411 and 412:
386 | Thermodynamics(c) The entropy
- Page 413 and 414:
388 | ThermodynamicsSubstituting, t
- Page 415 and 416:
390 | Thermodynamicsat 100°C while
- Page 417 and 418:
392 | ThermodynamicsCompressor: 125
- Page 419 and 420:
394 | ThermodynamicsThen the mass f
- Page 421 and 422:
396 | ThermodynamicsW electricMotor
- Page 423 and 424:
398 | ThermodynamicsOutsideairWallA
- Page 425 and 426:
400 | Thermodynamicsambient in a li
- Page 427 and 428:
402 | ThermodynamicsPROBLEMS*Entrop
- Page 429 and 430:
404 | Thermodynamicsthis problem. L
- Page 431 and 432:
406 | Thermodynamics7-62C Starting
- Page 433 and 434:
408 | Thermodynamics7-91 Liquid wat
- Page 435 and 436:
410 | Thermodynamicstemperature of
- Page 437 and 438:
412 | Thermodynamics7-136E In a pro
- Page 439 and 440:
414 | Thermodynamicsfull load, and
- Page 441 and 442:
416 | Thermodynamics7-174 Consider
- Page 443 and 444:
418 | Thermodynamicsare 104°C and
- Page 445 and 446:
420 | Thermodynamicswater pipe heat
- Page 447 and 448:
422 | Thermodynamicsisentropic effi
- Page 449 and 450:
424 | ThermodynamicsAIR25°C101 kPa
- Page 451 and 452:
426 | Thermodynamicsm⋅⋅W max =
- Page 453 and 454:
428 | ThermodynamicsAtmosphericairP
- Page 455 and 456:
430 | ThermodynamicsIRON200°C27°C
- Page 457 and 458:
432 | Thermodynamicsof heat to the
- Page 459 and 460:
434 | ThermodynamicsFor a heat engi
- Page 461 and 462:
436 | Thermodynamicswhen the direct
- Page 463 and 464:
438 | ThermodynamicsEnergy:Exergy:e
- Page 465 and 466:
440 | ThermodynamicsThe properties
- Page 467 and 468:
442 | ThermodynamicsHeattransferEnt
- Page 469 and 470:
444 | ThermodynamicsThis equation c
- Page 471 and 472:
446 | ThermodynamicsOutersurroundin
- Page 473 and 474:
448 | ThermodynamicsBrick27°Cwall0
- Page 475 and 476:
450 | ThermodynamicsThat is, if the
- Page 477 and 478:
452 | Thermodynamics(b) The reversi
- Page 479 and 480:
454 | Thermodynamics(a) Noting that
- Page 481 and 482:
456 | ThermodynamicsThe useful work
- Page 483 and 484:
458 | ThermodynamicsWX workm ic iSu
- Page 485 and 486:
460 | Thermodynamicscold stream, pr
- Page 487 and 488:
462 | Thermodynamics(c) The second-
- Page 489 and 490:
464 | ThermodynamicsAssumptions 1 A
- Page 491 and 492:
466 | Thermodynamics“Now I’m in
- Page 493 and 494:
468 | ThermodynamicsI have only jus
- Page 495 and 496:
470 | ThermodynamicsExergytransferb
- Page 497 and 498:
472 | Thermodynamics8-21 How much o
- Page 499 and 500:
474 | Thermodynamicsactivated to st
- Page 501 and 502:
476 | Thermodynamics8-66E Refrigera
- Page 503 and 504:
478 | Thermodynamics8-87 Ambient ai
- Page 505 and 506:
480 | Thermodynamicsof the inner an
- Page 507 and 508:
482 | Thermodynamicssteam. Neglecti
- Page 509 and 510:
484 | Thermodynamics8-137 An adiaba
- Page 512 and 513:
Chapter 9GAS POWER CYCLESTwo import
- Page 514 and 515:
Chapter 9 | 489FIGURE 9-4An automot
- Page 516 and 517:
Isothermalcompressorq out43Isentrop
- Page 518 and 519:
oom temperature (25°C, or 77°F).
- Page 520 and 521:
Initially, both the intake and the
- Page 522 and 523:
and the specific heat ratio. This i
- Page 524 and 525:
Chapter 9 | 499P 3 v 3T 3 P 2v 2T 2
- Page 526 and 527:
We now define a new quantity, the c
- Page 528 and 529:
Chapter 9 | 503Process 2-3 is a con
- Page 530 and 531:
or any kind of porous plug with a h
- Page 532 and 533:
have long been of only theoretical
- Page 534 and 535:
wherer p P 0.72(9-18)P 1 0.6Chapte
- Page 536 and 537:
2. Increasing the efficiencies of t
- Page 538 and 539:
h C w s h 4a2s h 1(9-19)2a4sw a h
- Page 540 and 541:
q regen,act h 5 h 2 (9-21)Chapter
- Page 542 and 543:
Chapter 9 | 517Discussion Note that
- Page 544 and 545:
If the number of compression and ex
- Page 546 and 547:
tion on the thermal efficiency is a
- Page 548 and 549:
emaining part of the energy release
- Page 550 and 551:
Discussion For those who are wonder
- Page 552 and 553:
Chapter 9 | 527Fuel nozzles or spra
- Page 554 and 555:
Chapter 9 | 529EXAMPLE 9-10Second-L
- Page 556 and 557:
Chapter 9 | 531use per vehicle in t
- Page 558 and 559:
Chapter 9 | 533Park in the GarageTh
- Page 560 and 561:
Chapter 9 | 535acceleration. Using
- Page 562 and 563:
Chapter 9 | 537pistons, and prevent
- Page 564 and 565:
Chapter 9 | 539PROBLEMS*Actual and
- Page 566 and 567:
modeled as polytropic with a polytr
- Page 568 and 569:
9-84 A gas-turbine power plant oper
- Page 570 and 571:
9-111 Repeat Problem 9-110 using ar
- Page 572 and 573:
9-137 Repeat Problem 9-136 using co
- Page 574 and 575:
maximum? At what pressure ratio doe
- Page 576 and 577:
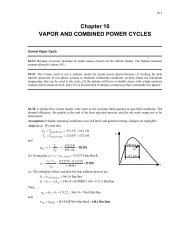
Chapter 10VAPOR AND COMBINED POWER
- Page 578 and 579:
This problem could be eliminated by
- Page 580:
or,wherew pump,in v 1P 2 P 1 2h 1
- Page 583 and 584:
558 | ThermodynamicsTIDEAL CYCLETIr
- Page 585 and 586:
560 | ThermodynamicsTurbine work ou
- Page 587 and 588:
562 | ThermodynamicsT21Criticalpoin
- Page 589 and 590:
564 | ThermodynamicsTherefore, the
- Page 591 and 592:
566 | ThermodynamicsTThe reheat cyc
- Page 593 and 594:
568 | ThermodynamicsandOpen Feedwat
- Page 595 and 596:
570 | Thermodynamicswherey m # 6>m
- Page 597 and 598:
572 | ThermodynamicsSome steam leav
- Page 599 and 600:
574 | ThermodynamicsDiscussion This
- Page 601 and 602:
576 | ThermodynamicsThus,andq in 1
- Page 603 and 604:
578 | ThermodynamicsTherefore, the
- Page 605 and 606:
580 | Thermodynamics3BoilerExpansio
- Page 607 and 608:
582 | Thermodynamicscycle and thus
- Page 609 and 610:
584 | Thermodynamicsin Fig. 10-24.
- Page 611 and 612:
586 | ThermodynamicsSteam cycle:(a)
- Page 613 and 614:
588 | ThermodynamicsT2 3BoilerMercu
- Page 615 and 616:
590 | ThermodynamicsPROBLEMS*Carnot
- Page 617 and 618:
592 | Thermodynamics410 kPa. Isobut
- Page 619 and 620:
594 | ThermodynamicsRegenerative Ra
- Page 621 and 622:
596 | Thermodynamics10-58 Reconside
- Page 623 and 624:
598 | ThermodynamicsCombined Gas-Va
- Page 625 and 626:
600 | Thermodynamics120 MW. Steam e
- Page 627 and 628:
602 | Thermodynamicsvaried from 0.5
- Page 629 and 630:
604 | Thermodynamicsan engineering
- Page 632 and 633:
Chapter 11REFRIGERATION CYCLESAmajo
- Page 634 and 635:
1 ton. One ton of refrigeration is
- Page 636 and 637:
Chapter 11 | 611WARMenvironmentT3Q
- Page 638 and 639:
Chapter 11 | 613EXAMPLE 11-1The Ide
- Page 640 and 641:
the evaporator to the compressor is
- Page 642 and 643:
choice of refrigerant depends on th
- Page 644 and 645:
ator coils is highly undesirable si
- Page 646 and 647:
Chapter 11 | 621WARMenvironment7Q H
- Page 648 and 649:
Chapter 11 | 623 10.05 kg>s231270.9
- Page 650 and 651:
Chapter 11 | 625T4h 4 = 274.48 kJ/k
- Page 652 and 653:
At temperatures above the critical-
- Page 654 and 655:
All the processes described are int
- Page 656 and 657:
Chapter 11 | 631(a) The maximum and
- Page 658 and 659:
hot NH 3 H 2 O solution, which is
- Page 660 and 661:
Chapter 11 | 635this manner form a
- Page 662 and 663:
Very low temperatures can be achiev
- Page 664 and 665:
space and the power input to the co
- Page 666 and 667:
Each stage operates on the ideal va
- Page 668 and 669:
5·Q L6Heatexch.Regenerator 3 Heate
- Page 670 and 671:
0.14 MPa. The working fluid is refr
- Page 672 and 673:
Consider a vortex tube that receive
- Page 674:
Chapter 11 | 649do calculations to
- Page 677 and 678:
652 | Thermodynamicsf(x)(x+∆ x)f(
- Page 679 and 680:
654 | ThermodynamicsEXAMPLE 12-2Tot
- Page 681 and 682:
656 | ThermodynamicsFunction: z + 2
- Page 683 and 684:
658 | ThermodynamicsEXAMPLE 12-4Ver
- Page 685 and 686:
660 | Thermodynamicswhere, from Tab
- Page 687 and 688:
662 | ThermodynamicsNow we choose t
- Page 689 and 690:
664 | ThermodynamicsSpecific Heats
- Page 691 and 692:
666 | ThermodynamicsAnalysis The ch
- Page 693 and 694:
668 | Thermodynamics>T 1 = 20°C T
- Page 695 and 696:
670 | ThermodynamicsTT 2Actualproce
- Page 697 and 698:
672 | Thermodynamicsfinally along t
- Page 699 and 700:
674 | ThermodynamicsandThen the ent
- Page 701 and 702:
676 | Thermodynamics12-3C Consider
- Page 703 and 704:
678 | Thermodynamics12-63 Propane i
- Page 705 and 706:
680 | Thermodynamics(a) proportiona
- Page 707 and 708:
682 | ThermodynamicsH 26 kg+O 232 k
- Page 709 and 710:
684 | ThermodynamicsorAlso,M m a y
- Page 711 and 712:
686 | ThermodynamicsP m V m = Z m N
- Page 713 and 714:
688 | Thermodynamics(c) When Amagat
- Page 715 and 716:
690 | ThermodynamicsSimilarly, the
- Page 717 and 718:
692 | ThermodynamicsandV O2 a NR uT
- Page 719 and 720:
694 | Thermodynamicsorwhich yieldsa
- Page 721 and 722:
696 | ThermodynamicsAlso,h m1 ,idea
- Page 723 and 724:
698 | ThermodynamicsMixture:i h i,m
- Page 725 and 726:
700 | Thermodynamicsof the pure com
- Page 727 and 728:
702 | Thermodynamicsentropy generat
- Page 729 and 730:
704 | Thermodynamicsthe second-law
- Page 731 and 732:
706 | Thermodynamicswater from the
- Page 733 and 734:
708 | ThermodynamicsSUMMARYA mixtur
- Page 735 and 736:
710 | Thermodynamics13-21C How is t
- Page 737 and 738:
712 | ThermodynamicsThe mixture ent
- Page 739 and 740:
714 | Thermodynamics13-84 A rigid t
- Page 742 and 743:
Chapter 14GAS-VAPOR MIXTURES AND AI
- Page 744 and 745:
elow 50°C. Therefore, the enthalpy
- Page 746 and 747:
Chapter 14 | 721Analysis (a) The pa
- Page 748 and 749:
Chapter 14 | 723starts condensing.
- Page 750 and 751:
on this principle is called a sling
- Page 752 and 753:
Chapter 14 | 727EXAMPLE 14-4The Use
- Page 754 and 755:
the environment is close to 100 per
- Page 756 and 757:
Heating with HumidificationProblems
- Page 758 and 759:
The cooling process with dehumidify
- Page 760 and 761:
Chapter 14 | 735EXAMPLE 14-7Evapora
- Page 762 and 763:
Chapter 14 | 737Analysis We take th
- Page 764 and 765:
Chapter 14 | 739Properties The enth
- Page 766 and 767:
Chapter 14 | 741REFERENCES AND SUGG
- Page 768 and 769:
14-47 Reconsider Prob. 14-46. Deter
- Page 770 and 771:
equired results. Plot the required
- Page 772 and 773:
WARMWATER60 kg/s40°CAIRINLET1 atmT
- Page 774 and 775:
AIRCooling coilsCondensateFIGURE P1
- Page 776 and 777:
Chapter 15CHEMICAL REACTIONSIn the
- Page 778 and 779:
Chapter 15 | 753TABLE 15-1A compari
- Page 780 and 781:
not required.) However, notice that
- Page 782 and 783:
In actual combustion processes, it
- Page 784 and 785:
Chapter 15 | 759Assumptions 1 The f
- Page 786 and 787:
Chapter 15 | 761The combustion equa
- Page 788 and 789:
ing which chemical energy is releas
- Page 790 and 791:
C 8 H 18 a th 1O 2 3.76N 2 2 S 8C
- Page 792 and 793:
Q out a N r 1h° f h h°2 r1555
- Page 794 and 795:
Chapter 15 | 769The h - f ° of liq
- Page 796 and 797:
H prod H react (15-16)Chapter 15 |
- Page 798 and 799:
Chapter 15 | 773which is lower than
- Page 800 and 801:
If a gas mixture is at a relatively
- Page 802 and 803:
Chapter 15 | 777EXAMPLE 15-10Second
- Page 804 and 805:
Chapter 15 | 779(a) the heat transf
- Page 806 and 807:
Chapter 15 | 781cal reactions, the
- Page 808 and 809:
Chapter 15 | 783In the absence of a
- Page 810 and 811:
15-42 Determine the enthalpy of com
- Page 812 and 813:
Chapter 15 | 78715-65E A constant-v
- Page 814 and 815:
air used, and (c) the volume flow r
- Page 816 and 817:
where C is a constant whose value d
- Page 818 and 819:
Chapter 16CHEMICAL AND PHASE EQUILI
- Page 820 and 821:
The differential of the Gibbs funct
- Page 822 and 823:
where g - * (T) represents the Gibb
- Page 824 and 825:
Chapter 16 | 799Analysis This is a
- Page 826 and 827:
moles of the reactants and increase
- Page 828 and 829:
Chapter 16 | 803EXAMPLE 16-4Effect
- Page 830 and 831:
Chapter 16 | 805EXAMPLE 16-5Equilib
- Page 832 and 833:
calculating the h of a reaction fro
- Page 834 and 835:
What happens if g f g g ? Obviousl
- Page 836 and 837:
two sides of a water-air interface
- Page 838 and 839:
where is the solubility. Expressin
- Page 840 and 841:
Chapter 16 | 815EXAMPLE 16-11Compos
- Page 842 and 843:
Chapter 16 | 817PROBLEMS*K P and th
- Page 844 and 845:
Simultaneous Reactions16-38C What i
- Page 846 and 847:
16-83 A constant-volume tank contai
- Page 848 and 849:
Chapter 17COMPRESSIBLE FLOWFor the
- Page 850 and 851:
stagnation pressure, stagnation den
- Page 852 and 853:
Chapter 17 | 827Disregarding potent
- Page 854 and 855:
at constant velocity in still air m
- Page 856 and 857:
Chapter 17 | 831TABLE 17-1Variation
- Page 858 and 859:
increase as the flow area of the du
- Page 860 and 861:
The ratio of the stagnation to stat
- Page 862 and 863:
Now we begin to reduce the back pre
- Page 864 and 865:
Another parameter sometimes used in
- Page 866 and 867:
Chapter 17 | 841Solution Nitrogen g
- Page 868 and 869:
Chapter 17 | 843P 0V i ≅ 0ThroatP
- Page 870 and 871:
Chapter 17 | 845(b) Since the flow
- Page 872 and 873:
The conservation of energy principl
- Page 874 and 875:
Chapter 17 | 849FIGURE 17-33Schlier
- Page 876 and 877:
Chapter 17 | 851The fluid propertie
- Page 878 and 879:
1 V 1,n A r 2 V 2,n A S r 1 V 1,n
- Page 880 and 881:
u, degrees504030201010 5Ma → 1 32
- Page 882 and 883:
where we must be careful to measure
- Page 884 and 885:
Chapter 17 | 859Analysis Because of
- Page 886 and 887:
1 V 1 r 2 V 2 (17-50)Chapter 17 |
- Page 888 and 889:
except for the narrow Mach number r
- Page 890 and 891:
Chapter 17 | 865Therefore, sonic co
- Page 892 and 893:
Also,P 0 P 0 P P* a 1 k 1 k>1k12M
- Page 894 and 895:
Chapter 17 | 869The maximum value o
- Page 896 and 897:
Analysis We denote the entrance, th
- Page 898 and 899:
Nozzles whose flow area decreases i
- Page 900 and 901:
17-24E Steam flows through a device
- Page 902 and 903:
17-77C Are the isentropic relations
- Page 904 and 905:
17-115E Steam enters a converging n
- Page 906:
17-154 Air is flowing in a wind tun