2003 Annual Report - Enerflex
2003 Annual Report - Enerflex
2003 Annual Report - Enerflex
You also want an ePaper? Increase the reach of your titles
YUMPU automatically turns print PDFs into web optimized ePapers that Google loves.
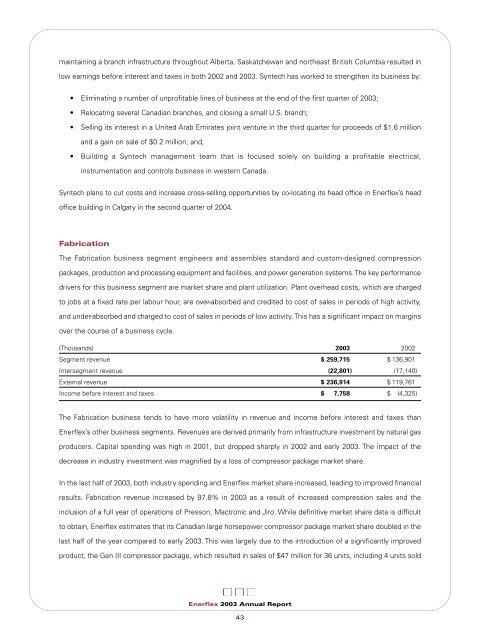
maintaining a branch infrastructure throughout Alberta, Saskatchewan and northeast British Columbia resulted inlow earnings before interest and taxes in both 2002 and <strong>2003</strong>. Syntech has worked to strengthen its business by:• Eliminating a number of unprofitable lines of business at the end of the first quarter of <strong>2003</strong>;• Relocating several Canadian branches, and closing a small U.S. branch;• Selling its interest in a United Arab Emirates joint venture in the third quarter for proceeds of $1.6 millionand a gain on sale of $0.2 million; and,• Building a Syntech management team that is focused solely on building a profitable electrical,instrumentation and controls business in western Canada.Syntech plans to cut costs and increase cross-selling opportunities by co-locating its head office in <strong>Enerflex</strong>’s headoffice building in Calgary in the second quarter of 2004.FabricationThe Fabrication business segment engineers and assembles standard and custom-designed compressionpackages, production and processing equipment and facilities, and power generation systems. The key performancedrivers for this business segment are market share and plant utilization. Plant overhead costs, which are chargedto jobs at a fixed rate per labour hour, are over-absorbed and credited to cost of sales in periods of high activity,and under-absorbed and charged to cost of sales in periods of low activity. This has a significant impact on marginsover the course of a business cycle.(Thousands) <strong>2003</strong> 2002Segment revenue $ 259,715 $ 136,901Intersegment revenue (22,801) (17,140)External revenue $ 236,914 $ 119,761Income before interest and taxes $ 7,758 $ (4,325)The Fabrication business tends to have more volatility in revenue and income before interest and taxes than<strong>Enerflex</strong>’s other business segments. Revenues are derived primarily from infrastructure investment by natural gasproducers. Capital spending was high in 2001, but dropped sharply in 2002 and early <strong>2003</strong>. The impact of thedecrease in industry investment was magnified by a loss of compressor package market share.In the last half of <strong>2003</strong>, both industry spending and <strong>Enerflex</strong> market share increased, leading to improved financialresults. Fabrication revenue increased by 97.8% in <strong>2003</strong> as a result of increased compression sales and theinclusion of a full year of operations of Presson, Mactronic and Jiro. While definitive market share data is difficultto obtain, <strong>Enerflex</strong> estimates that its Canadian large horsepower compressor package market share doubled in thelast half of the year compared to early <strong>2003</strong>. This was largely due to the introduction of a significantly improvedproduct, the Gen III compressor package, which resulted in sales of $47 million for 36 units, including 4 units sold<strong>Enerflex</strong> <strong>2003</strong> <strong>Annual</strong> <strong>Report</strong>43


