The tax effects of the significant components of temporary differences that give rise to future income tax assets and liabilitiesas at December 31 are as follows:<strong>2003</strong> 2002Assets Liabilities Assets LiabilitiesCurrent:Provisions $ 4,065 $ – $ 3,806 $ 2,235Tax losses – – 5,664 –4,065 – 9,470 2,235Long-term:Tax losses 1,981 – – –Capital assets 767 12,272 1,907 11,7082,748 12,272 1,907 11,708$ 6,813 $ 12,272 $ 11,377 $ 13,943The Company has available tax losses of $5,000,000, the benefit of which has been recognized based on the expected periodof utilization. These losses expire from time to time up to 2022.Current future income tax assets result from deductible temporary differences between the tax basis of the Company’s currentassets and liabilities and their carrying amounts. These relate primarily to provisions for overhaul, restructuring costs, doubtfulaccounts receivable and warranty expense and non-capital loss carryforwards expected to be utilized in the following year.Long-term future income tax assets result from deductible temporary differences between the tax basis of the Company’sproperty, plant and equipment and its carrying amount and non-capital loss carryforwards not expected to be utilized in thefollowing year.Current future income tax liabilities result from deductible temporary differences between the tax basis of accrued revenue andprogress billings and their carrying amount.Long-term future income tax liabilities result primarily from taxable temporary differences between the tax basis of the Company’srental equipment and its carrying amount.Note 14. FINANCIAL INSTRUMENTSForeign Exchange – In the normal course of operations, the Company is exposed to movements in the U.S. dollar, Australiandollar, the Pound Sterling and EURO exchange rates relative to the Canadian dollar. In order to mitigate these exposures, theCompany matches future foreign currency cash inflows with foreign currency denominated liabilities, primarily through thecurrency mix in short and long-term borrowings.From time to time, the Company also utilizes hedging instruments to create offsetting positions to specific exposures. Theseinstruments are employed in connection with an underlying asset, liability or anticipated transaction, and are not used forspeculative purposes.At December 31, <strong>2003</strong>, the Company had no currency contracts in place. At December 31, 2002 the Company had contracts tosell $3,500,000 (Australian) at an average rate of CDN/AUD $0.8603 in March and April <strong>2003</strong>. The fair value of these contracts atDecember 31, 2002 was a liability of approximately CDN$100,000.Credit Risk – A substantial portion of the Company’s accounts receivable are with customers in the oil and gas industry and aresubject to normal industry credit risks. The carrying amount of accounts receivable reflects management’s assessment of thecredit risk associated with these customers.Interest Rate Risk – The Company’s liabilities include certain long-term debt and bank indebtedness that are subject tofluctuations in interest rates. For each 1.0% change in the rate of interest on these loans, the change in interest expense wouldbe approximately $960,000 based upon the loan balances at December 31, <strong>2003</strong>.<strong>Enerflex</strong> <strong>2003</strong> <strong>Annual</strong> <strong>Report</strong>66
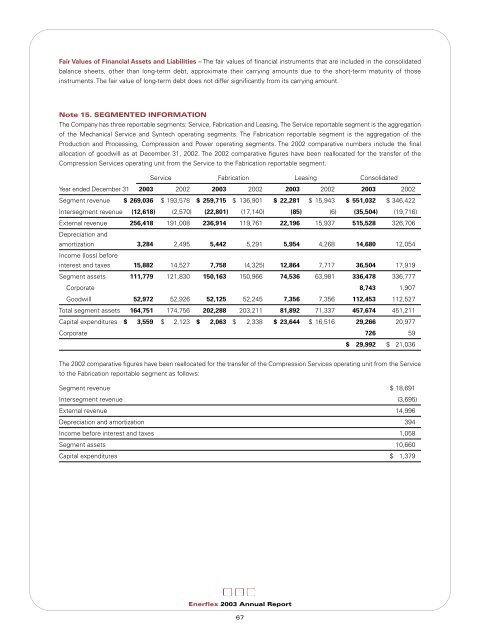
Fair Values of Financial Assets and Liabilities – The fair values of financial instruments that are included in the consolidatedbalance sheets, other than long-term debt, approximate their carrying amounts due to the short-term maturity of thoseinstruments. The fair value of long-term debt does not differ significantly from its carrying amount.Note 15. SEGMENTED INFORMATIONThe Company has three reportable segments: Service, Fabrication and Leasing. The Service reportable segment is the aggregationof the Mechanical Service and Syntech operating segments. The Fabrication reportable segment is the aggregation of theProduction and Processing, Compression and Power operating segments. The 2002 comparative numbers include the finalallocation of goodwill as at December 31, 2002. The 2002 comparative figures have been reallocated for the transfer of theCompression Services operating unit from the Service to the Fabrication reportable segment.Service Fabrication Leasing ConsolidatedYear ended December 31 <strong>2003</strong> 2002 <strong>2003</strong> 2002 <strong>2003</strong> 2002 <strong>2003</strong> 2002Segment revenue $ 269,036 $ 193,578 $ 259,715 $ 136,901 $ 22,281 $ 15,943 $ 551,032 $ 346,422Intersegment revenue (12,618) (2,570) (22,801) (17,140) (85) (6) (35,504) (19,716)External revenue 256,418 191,008 236,914 119,761 22,196 15,937 515,528 326,706Depreciation andamortization 3,284 2,495 5,442 5,291 5,954 4,268 14,680 12,054Income (loss) beforeinterest and taxes 15,882 14,527 7,758 (4,325) 12,864 7,717 36,504 17,919Segment assets 111,779 121,830 150,163 150,966 74,536 63,981 336,478 336,777Corporate 8,743 1,907Goodwill 52,972 52,926 52,125 52,245 7,356 7,356 112,453 112,527Total segment assets 164,751 174,756 202,288 203,211 81,892 71,337 457,674 451,211Capital expenditures $ 3,559 $ 2,123 $ 2,063 $ 2,338 $ 23,644 $ 16,516 29,266 20,977Corporate 726 59$ 29,992 $ 21,036The 2002 comparative figures have been reallocated for the transfer of the Compression Services operating unit from the Serviceto the Fabrication reportable segment as follows:Segment revenue $ 18,691Intersegment revenue (3,695)External revenue 14,996Depreciation and amortization 394Income before interest and taxes 1,058Segment assets 10,660Capital expenditures $ 1,379<strong>Enerflex</strong> <strong>2003</strong> <strong>Annual</strong> <strong>Report</strong>67