2003 Annual Report - Enerflex
2003 Annual Report - Enerflex
2003 Annual Report - Enerflex

You also want an ePaper? Increase the reach of your titles
YUMPU automatically turns print PDFs into web optimized ePapers that Google loves.
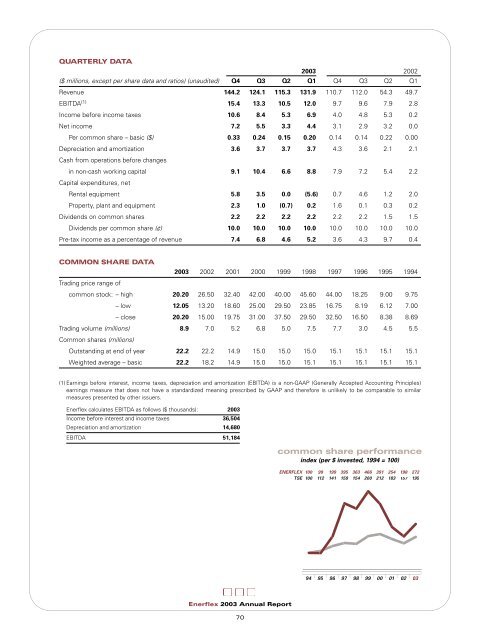
QUARTERLY DATA<strong>2003</strong> 2002($ millions, except per share data and ratios) (unaudited) Q4 Q3 Q2 Q1 Q4 Q3 Q2 Q1Revenue 144.2 124.1 115.3 131.9 110.7 112.0 54.3 49.7EBITDA (1) 15.4 13.3 10.5 12.0 9.7 9.6 7.9 2.8Income before income taxes 10.6 8.4 5.3 6.9 4.0 4.8 5.3 0.2Net income 7.2 5.5 3.3 4.4 3.1 2.9 3.2 0.0Per common share – basic ($) 0.33 0.24 0.15 0.20 0.14 0.14 0.22 0.00Depreciation and amortization 3.6 3.7 3.7 3.7 4.3 3.6 2.1 2.1Cash from operations before changesin non-cash working capital 9.1 10.4 6.6 8.8 7.9 7.2 5.4 2.2Capital expenditures, netRental equipment 5.8 3.5 0.0 (5.6) 0.7 4.6 1.2 2.0Property, plant and equipment 2.3 1.0 (0.7) 0.2 1.6 0.1 0.3 0.2Dividends on common shares 2.2 2.2 2.2 2.2 2.2 2.2 1.5 1.5Dividends per common share (¢) 10.0 10.0 10.0 10.0 10.0 10.0 10.0 10.0Pre-tax income as a percentage of revenue 7.4 6.8 4.6 5.2 3.6 4.3 9.7 0.4COMMON SHARE DATA<strong>2003</strong> 2002 2001 2000 1999 1998 1997 1996 1995 1994Trading price range ofcommon stock: – high 20.20 26.50 32.40 42.00 40.00 45.60 44.00 18.25 9.00 9.75– low 12.05 13.20 18.60 25.00 29.50 23.85 16.75 8.19 6.12 7.00– close 20.20 15.00 19.75 31.00 37.50 29.50 32.50 16.50 8.38 8.69Trading volume (millions) 8.9 7.0 5.2 6.8 5.0 7.5 7.7 3.0 4.5 5.5Common shares (millions)Outstanding at end of year 22.2 22.2 14.9 15.0 15.0 15.0 15.1 15.1 15.1 15.1Weighted average – basic 22.2 18.2 14.9 15.0 15.0 15.1 15.1 15.1 15.1 15.1(1) Earnings before interest, income taxes, depreciation and amortization (EBlTDA) is a non-GAAP (Generally Accepted Accounting Principles)earnings measure that does not have a standardized meaning prescribed by GAAP and therefore is unlikely to be comparable to similarmeasures presented by other issuers.<strong>Enerflex</strong> calculates EBITDA as follows ($ thousands): <strong>2003</strong>Income before interest and income taxes 36,504Depreciation and amortization 14,680EBITDA 51,184common share performanceindex (per $ invested, 1994 = 100)ENERFLEX 100 99 199 395 363 466 391 254 198 272TSE 100 112 141 159 154 200 212 183 157 19594 95 96 97 98 99 00 01 02 03<strong>Enerflex</strong> <strong>2003</strong> <strong>Annual</strong> <strong>Report</strong>70