2003 Annual Report - Enerflex
2003 Annual Report - Enerflex
2003 Annual Report - Enerflex

Create successful ePaper yourself
Turn your PDF publications into a flip-book with our unique Google optimized e-Paper software.
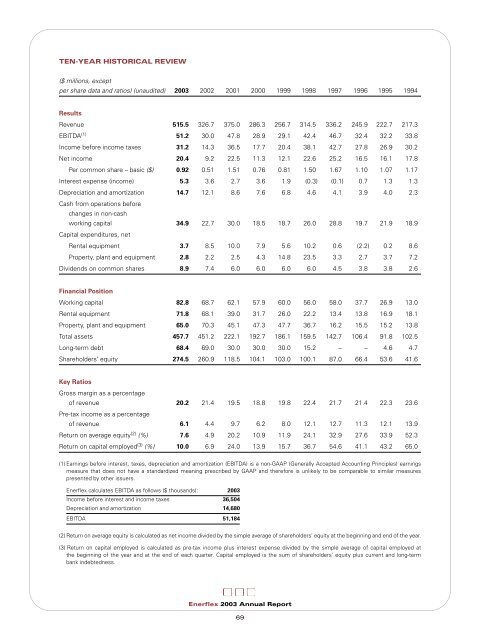
TEN-YEAR HISTORICAL REVIEW($ millions, exceptper share data and ratios) (unaudited) <strong>2003</strong> 2002 2001 2000 1999 1998 1997 1996 1995 1994ResultsRevenue 515.5 326.7 375.0 286.3 256.7 314.5 336.2 245.9 222.7 217.3EBITDA (1) 51.2 30.0 47.8 28.9 29.1 42.4 46.7 32.4 32.2 33.8Income before income taxes 31.2 14.3 36.5 17.7 20.4 38.1 42.7 27.8 26.9 30.2Net income 20.4 9.2 22.5 11.3 12.1 22.6 25.2 16.5 16.1 17.8Per common share – basic ($) 0.92 0.51 1.51 0.76 0.81 1.50 1.67 1.10 1.07 1.17Interest expense (income) 5.3 3.6 2.7 3.6 1.9 (0.3) (0.1) 0.7 1.3 1.3Depreciation and amortization 14.7 12.1 8.6 7.6 6.8 4.6 4.1 3.9 4.0 2.3Cash from operations beforechanges in non-cashworking capital 34.9 22.7 30.0 18.5 18.7 26.0 28.8 19.7 21.9 18.9Capital expenditures, netRental equipment 3.7 8.5 10.0 7.9 5.6 10.2 0.6 (2.2) 0.2 8.6Property, plant and equipment 2.8 2.2 2.5 4.3 14.8 23.5 3.3 2.7 3.7 7.2Dividends on common shares 8.9 7.4 6.0 6.0 6.0 6.0 4.5 3.8 3.8 2.6Financial PositionWorking capital 82.8 68.7 62.1 57.9 60.0 56.0 58.0 37.7 26.9 13.0Rental equipment 71.8 68.1 39.0 31.7 26.0 22.2 13.4 13.8 16.9 18.1Property, plant and equipment 65.0 70.3 45.1 47.3 47.7 36.7 16.2 15.5 15.2 13.8Total assets 457.7 451.2 222.1 192.7 186.1 159.5 142.7 106.4 91.8 102.5Long-term debt 68.4 69.0 30.0 30.0 30.0 15.2 – – 4.6 4.7Shareholders’ equity 274.5 260.9 118.5 104.1 103.0 100.1 87.0 66.4 53.6 41.6Key RatiosGross margin as a percentageof revenue 20.2 21.4 19.5 18.8 19.8 22.4 21.7 21.4 22.3 23.6Pre-tax income as a percentageof revenue 6.1 4.4 9.7 6.2 8.0 12.1 12.7 11.3 12.1 13.9Return on average equity (2) (%) 7.6 4.9 20.2 10.9 11.9 24.1 32.9 27.6 33.9 52.3Return on capital employed (3) (%) 10.0 6.9 24.0 13.9 15.7 36.7 54.6 41.1 43.2 65.0(1) Earnings before interest, taxes, depreciation and amortization (EBlTDA) is a non-GAAP (Generally Accepted Accounting Principles) earningsmeasure that does not have a standardized meaning prescribed by GAAP and therefore is unlikely to be comparable to similar measurespresented by other issuers.<strong>Enerflex</strong> calculates EBITDA as follows ($ thousands): <strong>2003</strong>Income before interest and income taxes 36,504Depreciation and amortization 14,680EBITDA 51,184(2) Return on average equity is calculated as net income divided by the simple average of shareholders’ equity at the beginning and end of the year.(3) Return on capital employed is calculated as pre-tax income plus interest expense divided by the simple average of capital employed atthe beginning of the year and at the end of each quarter. Capital employed is the sum of shareholders’ equity plus current and long-termbank indebtedness.<strong>Enerflex</strong> <strong>2003</strong> <strong>Annual</strong> <strong>Report</strong>69