2 Renmark to border LAP area assessment - EPA - Sa.gov.au
2 Renmark to border LAP area assessment - EPA - Sa.gov.au
2 Renmark to border LAP area assessment - EPA - Sa.gov.au

You also want an ePaper? Increase the reach of your titles
YUMPU automatically turns print PDFs into web optimized ePapers that Google loves.
River Murray and Lower Lakes catchment risk <strong>assessment</strong> for water quality: Results and management options<br />
3.4 Risks <strong>to</strong> water quality in the Berri–Barmera and Lox<strong>to</strong>n–Bookpurnong<br />
<strong>area</strong>s<br />
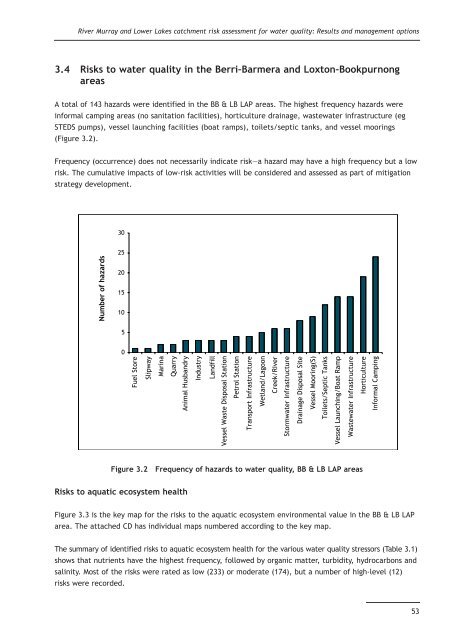
A <strong>to</strong>tal of 143 hazards were identified in the BB & LB <strong>LAP</strong> <strong>area</strong>s. The highest frequency hazards were<br />
informal camping <strong>area</strong>s (no sanitation facilities), horticulture drainage, wastewater infrastructure (eg<br />
STEDS pumps), vessel l<strong>au</strong>nching facilities (boat ramps), <strong>to</strong>ilets/septic tanks, and vessel moorings<br />
(Figure 3.2).<br />
Frequency (occurrence) does not necessarily indicate risk—a hazard may have a high frequency but a low<br />
risk. The cumulative impacts of low-risk activities will be considered and assessed as part of mitigation<br />
strategy development.<br />
Number of hazards<br />
30<br />
25<br />
20<br />
15<br />
10<br />
Figure 3.2 Frequency of hazards <strong>to</strong> water quality, BB & LB <strong>LAP</strong> <strong>area</strong>s<br />
Risks <strong>to</strong> aquatic ecosystem health<br />
5<br />
0<br />
Fuel S<strong>to</strong>re<br />
Slipway<br />
Marina<br />
Quarry<br />
Animal Husbandry<br />
Industry<br />
Landfill<br />
Vessel Waste Disposal Station<br />
Petrol Station<br />
Figure 3.3 is the key map for the risks <strong>to</strong> the aquatic ecosystem environmental value in the BB & LB <strong>LAP</strong><br />
<strong>area</strong>. The attached CD has individual maps numbered according <strong>to</strong> the key map.<br />
The summary of identified risks <strong>to</strong> aquatic ecosystem health for the various water quality stressors (Table 3.1)<br />
shows that nutrients have the highest frequency, followed by organic matter, turbidity, hydrocarbons and<br />
salinity. Most of the risks were rated as low (233) or moderate (174), but a number of high-level (12)<br />
risks were recorded.<br />
Transport Infrastructure<br />
Wetland/Lagoon<br />
Creek/River<br />
S<strong>to</strong>rmwater Infrastructure<br />
Drainage Disposal Site<br />
Vessel Mooring(S)<br />
Toilets/Septic Tanks<br />
Vessel L<strong>au</strong>nching/Boat Ramp<br />
Wastewater Infrastructure<br />
Horticulture<br />
Informal Camping<br />
53