Appendix A: MethodsCount<strong>of</strong> ies NumberTable A–1: 2005 Stratum Pr<strong>of</strong>iles for Delinquency DataCounties reporting compatible dataNumber <strong>of</strong> countiesCounty population Counties Case- <strong>Court</strong>- Percentage <strong>of</strong>Stratum ages 10–17 in stratum level level Total* juvenile population1 Fewer than 13,000 2,618 1,645 135 1,780 71%2 13,000–54,900 335 235 14 249 743 54,901–145,000 101 74 2 76 774 More than 145,000 31 29 2 30 98Total 3,085 1,983 153 2,135 80* Some counties reported both case-level <strong>and</strong> court-level data; therefore, the total number <strong>of</strong> counties reporting delinquency data is not equalto the number <strong>of</strong> counties reporting case-level data plus the number <strong>of</strong> counties reporting court-level data.Count<strong>of</strong> ies NumberTable A–2: 2005 Stratum Pr<strong>of</strong>iles for Status Offense DataCounties reporting compatible dataNumber <strong>of</strong> countiesCounty population Counties Case- <strong>Court</strong>- Percentage <strong>of</strong>Stratum ages 10–17 in stratum level level Total juvenile population1 Fewer than 13,000 2,618 1,701 172 1,873 74%2 13,000–54,900 335 215 28 243 723 54,901–145,000 101 59 7 66 684 More than 145,000 31 24 5 29 95Total 3,085 1,999 212 2,211 77The aggregation <strong>of</strong> the JCS-compatiblest<strong>and</strong>ardized case-level data filesconstitutes the Archive’s nationalcase-level database. The compileddata from jurisdictions that contributeonly court-level JCS-compatiblestatistics constitute the nationalcourt-level database. Together, thesetwo multijurisdictional databases(case-level <strong>and</strong> court-level) are usedto generate the Archive’s nationalestimates <strong>of</strong> delinquency <strong>and</strong> status<strong>of</strong>fense cases.In 2005, case-level data describing1,174,857 delinquency cases h<strong>and</strong>ledby 1,983 jurisdictions in 38 States metthe Archive’s criteria for inclusion inthe development <strong>of</strong> national delinquencyestimates. Compatible datawere available from Alabama, Alaska,Arizona, Arkansas, California,Connecticut, District <strong>of</strong> Columbia,Florida, Georgia, Hawaii, Illinois,Kentucky, Maine, Maryl<strong>and</strong>, Michigan,Minnesota, Missouri, Montana,Nebraska, Nevada, New Jersey, NewMexico, New York, North Carolina,Ohio, Oklahoma, Oregon, Pennsylvania,Rhode Isl<strong>and</strong>, South Carolina,South Dakota, Tennessee, Texas,Utah, Virginia, Washington, WestVirginia, <strong>and</strong> Wisconsin. These courtshad jurisdiction over 76% <strong>of</strong> thenation’s juvenile population in <strong>2005.</strong>Compatible court-level aggregate statisticson an additional 51,570 delinquencycases from 153 jurisdictionswere used from California, Idaho,Illinois, Indiana, <strong>and</strong> Vermont. In all,the Archive collected compatiblecase-level data <strong>and</strong> court-level statisticson delinquency cases from 2,135jurisdictions containing 80% <strong>of</strong> theNation’s juvenile population in 2005(table A–1).Case-level data describing 95,660 formallyh<strong>and</strong>led status <strong>of</strong>fense casesfrom 1,999 jurisdictions in 36 statesmet the criteria for inclusion in thesample for <strong>2005.</strong> The States includedAlabama, Alaska, Arizona, Arkansas,California, Connecticut, District <strong>of</strong>Columbia, Florida, Georgia, Hawaii,Illinois, Kentucky, Maine, Maryl<strong>and</strong>,Michigan, Minnesota, Missouri,Montana, Nebraska, Nevada, NewMexico, North Carolina, Ohio,Oklahoma, Oregon, Pennsylvania,Rhode Isl<strong>and</strong>, South Carolina, SouthDakota, Tennessee, Texas, Utah,Virginia, Washington, West Virginia,<strong>and</strong> Wisconsin. These courts hadjurisdiction over 69% <strong>of</strong> the juvenilepopulation. An additional 212 jurisdictionsin 4 states (Idaho, Indiana,New York, <strong>and</strong> Vermont) had compatiblecourt-level aggregate statistics on13,673 petitioned status <strong>of</strong>fensecases. Altogether, compatible caselevel<strong>and</strong> court-level data on petitionedstatus <strong>of</strong>fense cases wereavailable from 2,211 jurisdictions containing77% <strong>of</strong> the U.S. juvenile populationin 2005 (table A–2).A list <strong>of</strong> States contributing case-leveldata (either delinquency or petitionedstatus <strong>of</strong>fense data), the variableseach reports, <strong>and</strong> the percentage <strong>of</strong>cases containing each variable arepresented in table A–3.94<strong>Juvenile</strong> <strong>Court</strong> <strong>Statistics</strong> 2005
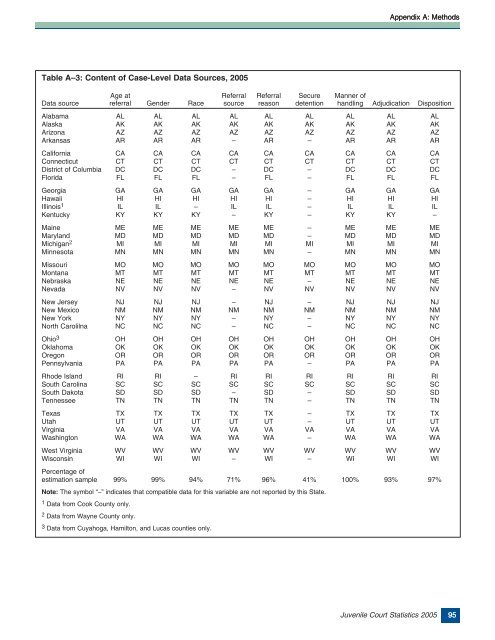
Appendix A: MethodsTable A–3: Content <strong>of</strong> Case-Level Data Sources, 2005Age at Referral Referral Secure Manner <strong>of</strong>Data source referral Gender Race source reason detention h<strong>and</strong>ling Adjudication DispositionAlabama AL AL AL AL AL AL AL AL ALAlaska AK AK AK AK AK AK AK AK AKArizona AZ AZ AZ AZ AZ AZ AZ AZ AZArkansas AR AR AR – AR – AR AR ARCalifornia CA CA CA CA CA CA CA CA CAConnecticut CT CT CT CT CT CT CT CT CTDistrict <strong>of</strong> Columbia DC DC DC – DC – DC DC DCFlorida FL FL FL – FL – FL FL FLGeorgia GA GA GA GA GA – GA GA GAHawaii HI HI HI HI HI – HI HI HIIllinois 1 IL IL – IL IL – IL IL ILKentucky KY KY KY – KY – KY KY –Maine ME ME ME ME ME – ME ME MEMaryl<strong>and</strong> MD MD MD MD MD – MD MD MDMichigan 2 MI MI MI MI MI MI MI MI MIMinnesota MN MN MN MN MN – MN MN MNMissouri MO MO MO MO MO MO MO MO MOMontana MT MT MT MT MT MT MT MT MTNebraska NE NE NE NE NE – NE NE NENevada NV NV NV – NV NV NV NV NVNew Jersey NJ NJ NJ – NJ – NJ NJ NJNew Mexico NM NM NM NM NM NM NM NM NMNew York NY NY NY – NY – NY NY NYNorth Carolilna NC NC NC – NC – NC NC NCOhio 3 OH OH OH OH OH OH OH OH OHOklahoma OK OK OK OK OK OK OK OK OKOregon OR OR OR OR OR OR OR OR ORPennsylvania PA PA PA PA PA – PA PA PARhode Isl<strong>and</strong> RI RI – RI RI RI RI RI RISouth Carolina SC SC SC SC SC SC SC SC SCSouth Dakota SD SD SD – SD – SD SD SDTennessee TN TN TN TN TN – TN TN TNTexas TX TX TX TX TX – TX TX TXUtah UT UT UT UT UT – UT UT UTVirginia VA VA VA VA VA VA VA VA VAWashington WA WA WA WA WA – WA WA WAWest Virginia WV WV WV WV WV WV WV WV WVWisconsin WI WI WI – WI – WI WI WIPercentage <strong>of</strong>estimation sample 99% 99% 94% 71% 96% 41% 100% 93% 97%Note: The symbol “–” indicates that compatible data for this variable are not reported by this State.1 Data from Cook County only.2 Data from Wayne County only.3 Data from Cuyahoga, Hamilton, <strong>and</strong> Lucas counties only.<strong>Juvenile</strong> <strong>Court</strong> <strong>Statistics</strong> 2005 95


![Chapter 5 [PDF] - Office of Juvenile Justice and Delinquency ...](https://img.yumpu.com/46584340/1/190x245/chapter-5-pdf-office-of-juvenile-justice-and-delinquency-.jpg?quality=85)