Juvenile Court Statistics 2005. - Office of Juvenile Justice and ...
Juvenile Court Statistics 2005. - Office of Juvenile Justice and ...
Juvenile Court Statistics 2005. - Office of Juvenile Justice and ...
- No tags were found...

You also want an ePaper? Increase the reach of your titles
YUMPU automatically turns print PDFs into web optimized ePapers that Google loves.
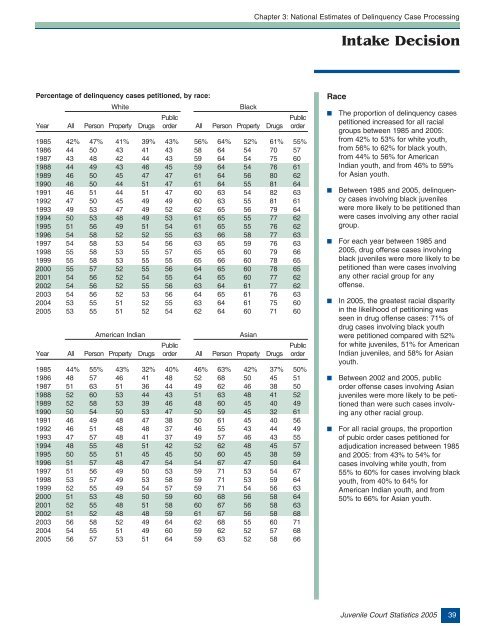
Chapter 3: National Estimates <strong>of</strong> Delinquency Case ProcessingIntake DecisionPercentage <strong>of</strong> delinquency cases petitioned, by race:WhiteBlackPublicPublicYear All Person Property Drugs order All Person Property Drugs order1985 42% 47% 41% 39% 43% 56% 64% 52% 61% 55%1986 44 50 43 41 43 58 64 54 70 571987 43 48 42 44 43 59 64 54 75 601988 44 49 43 46 45 59 64 54 76 611989 46 50 45 47 47 61 64 56 80 621990 46 50 44 51 47 61 64 55 81 641991 46 51 44 51 47 60 63 54 82 631992 47 50 45 49 49 60 63 55 81 611993 49 53 47 49 52 62 65 56 79 641994 50 53 48 49 53 61 65 55 77 621995 51 56 49 51 54 61 65 55 76 621996 54 58 52 52 55 63 66 58 77 631997 54 58 53 54 56 63 65 59 76 631998 55 58 53 55 57 65 65 60 79 661999 55 58 53 55 55 65 66 60 78 652000 55 57 52 55 56 64 65 60 78 652001 54 56 52 54 55 64 65 60 77 622002 54 56 52 55 56 63 64 61 77 622003 54 56 52 53 56 64 65 61 76 632004 53 55 51 52 55 63 64 61 75 602005 53 55 51 52 54 62 64 60 71 60American IndianAsianPublicPublicYear All Person Property Drugs order All Person Property Drugs order1985 44% 55% 43% 32% 40% 46% 63% 42% 37% 50%1986 48 57 46 41 48 52 68 50 45 511987 51 63 51 36 44 49 62 46 38 501988 52 60 53 44 43 51 63 48 41 521989 52 58 53 39 46 48 60 45 40 491990 50 54 50 53 47 50 59 45 32 611991 46 49 48 47 38 50 61 45 40 561992 46 51 48 48 37 46 55 43 44 491993 47 57 48 41 37 49 57 46 43 551994 48 55 48 51 42 52 62 48 45 571995 50 55 51 45 45 50 60 45 38 591996 51 57 48 47 54 54 67 47 50 641997 51 56 49 50 53 59 71 53 54 671998 53 57 49 53 58 59 71 53 59 641999 52 55 49 54 57 59 71 54 56 632000 51 53 48 50 59 60 68 56 58 642001 52 55 48 51 58 60 67 56 58 632002 51 52 48 48 59 61 67 56 58 682003 56 58 52 49 64 62 68 55 60 712004 54 55 51 49 60 59 62 52 57 682005 56 57 53 51 64 59 63 52 58 66Race■■■■■■The proportion <strong>of</strong> delinquency casespetitioned increased for all racialgroups between 1985 <strong>and</strong> 2005:from 42% to 53% for white youth,from 56% to 62% for black youth,from 44% to 56% for AmericanIndian youth, <strong>and</strong> from 46% to 59%for Asian youth.Between 1985 <strong>and</strong> 2005, delinquencycases involving black juvenileswere more likely to be petitioned thanwere cases involving any other racialgroup.For each year between 1985 <strong>and</strong>2005, drug <strong>of</strong>fense cases involvingblack juveniles were more likely to bepetitioned than were cases involvingany other racial group for any<strong>of</strong>fense.In 2005, the greatest racial disparityin the likelihood <strong>of</strong> petitioning wasseen in drug <strong>of</strong>fense cases: 71% <strong>of</strong>drug cases involving black youthwere petitioned compared with 52%for white juveniles, 51% for AmericanIndian juveniles, <strong>and</strong> 58% for Asianyouth.Between 2002 <strong>and</strong> 2005, publicorder <strong>of</strong>fense cases involving Asianjuveniles were more likely to be petitionedthan were such cases involvingany other racial group.For all racial groups, the proportion<strong>of</strong> pubic order cases petitioned foradjudication increased between 1985<strong>and</strong> 2005: from 43% to 54% forcases involving white youth, from55% to 60% for cases involving blackyouth, from 40% to 64% forAmerican Indian youth, <strong>and</strong> from50% to 66% for Asian youth.<strong>Juvenile</strong> <strong>Court</strong> <strong>Statistics</strong> 2005 39

![Chapter 5 [PDF] - Office of Juvenile Justice and Delinquency ...](https://img.yumpu.com/46584340/1/190x245/chapter-5-pdf-office-of-juvenile-justice-and-delinquency-.jpg?quality=85)