Juvenile Court Statistics 2005. - Office of Juvenile Justice and ...
Juvenile Court Statistics 2005. - Office of Juvenile Justice and ...
Juvenile Court Statistics 2005. - Office of Juvenile Justice and ...
- No tags were found...

You also want an ePaper? Increase the reach of your titles
YUMPU automatically turns print PDFs into web optimized ePapers that Google loves.
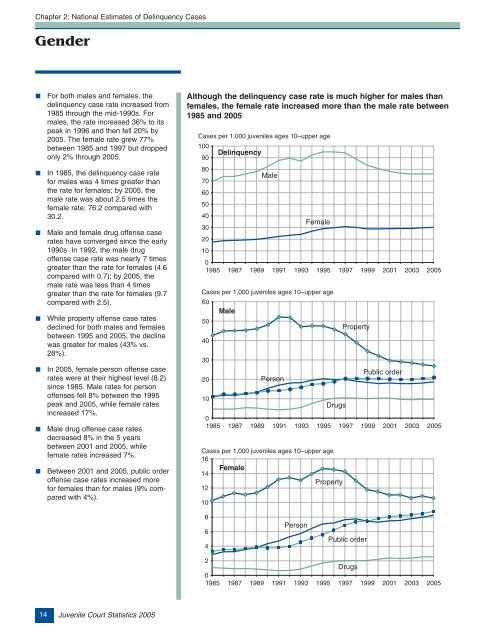
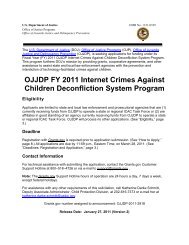
Chapter 2: National Estimates <strong>of</strong> Delinquency CasesGender■■■■■■■For both males <strong>and</strong> females, thedelinquency case rate increased from1985 through the mid-1990s. Formales, the rate increased 36% to itspeak in 1996 <strong>and</strong> then fell 20% by<strong>2005.</strong> The female rate grew 77%between 1985 <strong>and</strong> 1997 but droppedonly 2% through <strong>2005.</strong>In 1985, the delinquency case ratefor males was 4 times greater thanthe rate for females; by 2005, themale rate was about 2.5 times thefemale rate: 76.2 compared with30.2.Male <strong>and</strong> female drug <strong>of</strong>fense caserates have converged since the early1990s. In 1992, the male drug<strong>of</strong>fense case rate was nearly 7 timesgreater than the rate for females (4.6compared with 0.7); by 2005, themale rate was less than 4 timesgreater than the rate for females (9.7compared with 2.5).While property <strong>of</strong>fense case ratesdeclined for both males <strong>and</strong> femalesbetween 1995 <strong>and</strong> 2005, the declinewas greater for males (43% vs.28%).In 2005, female person <strong>of</strong>fense caserates were at their highest level (8.2)since 1985. Male rates for person<strong>of</strong>fenses fell 8% between the 1995peak <strong>and</strong> 2005, while female ratesincreased 17%.Male drug <strong>of</strong>fense case ratesdecreased 8% in the 5 yearsbetween 2001 <strong>and</strong> 2005, whilefemale rates increased 7%.Between 2001 <strong>and</strong> 2005, public order<strong>of</strong>fense case rates increased morefor females than for males (9% comparedwith 4%).Although the delinquency case rate is much higher for males thanfemales, the female rate increased more than the male rate between1985 <strong>and</strong> 2005Cases per 1,000 juveniles ages 10–upper age100908070605040302010Cases per 1,000 juveniles ages 10–upper age60504030201001985 1987 1989 1991 1993 1995 1997 1999 2001 2003 2005Cases per 1,000 juveniles ages 10–upper age16Female14Property1210Delinquency01985 1987 1989 1991 1993 1995 1997 1999 2001 2003 2005MaleMalePersonFemaleDrugsPropertyPublic order864PersonPublic order2Drugs01985 1987 1989 1991 1993 1995 1997 1999 2001 2003 200514<strong>Juvenile</strong> <strong>Court</strong> <strong>Statistics</strong> 2005

![Chapter 5 [PDF] - Office of Juvenile Justice and Delinquency ...](https://img.yumpu.com/46584340/1/190x245/chapter-5-pdf-office-of-juvenile-justice-and-delinquency-.jpg?quality=85)