Juvenile Court Statistics 2005. - Office of Juvenile Justice and ...
Juvenile Court Statistics 2005. - Office of Juvenile Justice and ...
Juvenile Court Statistics 2005. - Office of Juvenile Justice and ...
- No tags were found...

Create successful ePaper yourself
Turn your PDF publications into a flip-book with our unique Google optimized e-Paper software.
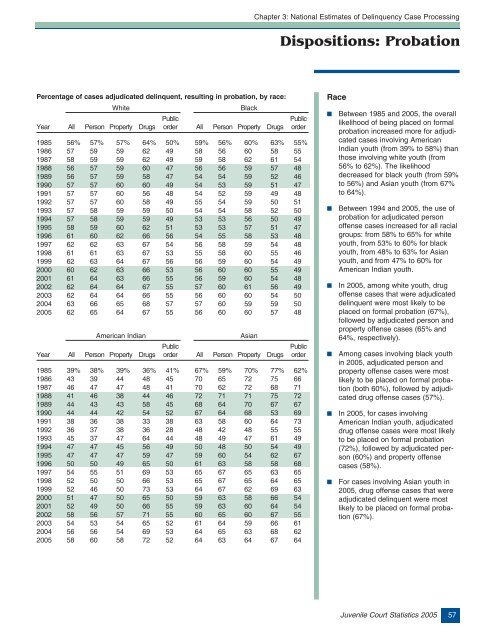
Chapter 3: National Estimates <strong>of</strong> Delinquency Case ProcessingDispositions: ProbationPercentage <strong>of</strong> cases adjudicated delinquent, resulting in probation, by race:WhiteBlackPublicPublicYear All Person Property Drugs order All Person Property Drugs order1985 56% 57% 57% 64% 50% 59% 56% 60% 63% 55%1986 57 59 59 62 49 58 56 60 58 551987 58 59 59 62 49 59 58 62 61 541988 56 57 59 60 47 56 56 59 57 481989 56 57 59 58 47 54 54 59 52 461990 57 57 60 60 49 54 53 59 51 471991 57 57 60 56 48 54 52 59 49 481992 57 57 60 58 49 55 54 59 50 511993 57 58 59 59 50 54 54 58 52 501994 57 58 59 59 49 53 53 56 50 491995 58 59 60 62 51 53 53 57 51 471996 61 60 62 66 56 54 55 58 53 481997 62 62 63 67 54 56 58 59 54 481998 61 61 63 67 53 55 58 60 55 461999 62 63 64 67 56 56 59 60 54 492000 60 62 63 66 53 56 60 60 55 492001 61 64 63 66 55 56 59 60 54 482002 62 64 64 67 55 57 60 61 56 492003 62 64 64 66 55 56 60 60 54 502004 63 66 65 68 57 57 60 59 59 502005 62 65 64 67 55 56 60 60 57 48American IndianAsianPublicPublicYear All Person Property Drugs order All Person Property Drugs order1985 39% 38% 39% 36% 41% 67% 59% 70% 77% 62%1986 43 39 44 48 45 70 65 72 75 661987 46 47 47 48 41 70 62 72 68 711988 41 46 38 44 46 72 71 71 75 721989 44 43 43 58 45 68 64 70 67 671990 44 44 42 54 52 67 64 68 53 691991 38 36 38 33 38 63 58 60 64 731992 36 37 38 36 28 48 42 48 55 551993 45 37 47 64 44 48 49 47 61 491994 47 47 45 56 49 50 48 50 54 491995 47 47 47 59 47 59 60 54 62 671996 50 50 49 65 50 61 63 58 58 681997 54 55 51 69 53 65 67 65 63 651998 52 50 50 66 53 65 67 65 64 651999 52 46 50 73 53 64 67 62 69 632000 51 47 50 65 50 59 63 58 66 542001 52 49 50 66 55 59 63 60 64 542002 58 56 57 71 55 60 65 60 67 552003 54 53 54 65 52 61 64 59 66 612004 56 56 54 69 53 64 65 63 68 622005 58 60 58 72 52 64 63 64 67 64Race■■■■■■Between 1985 <strong>and</strong> 2005, the overalllikelihood <strong>of</strong> being placed on formalprobation increased more for adjudicatedcases involving AmericanIndian youth (from 39% to 58%) thanthose involving white youth (from56% to 62%). The likelihooddecreased for black youth (from 59%to 56%) <strong>and</strong> Asian youth (from 67%to 64%).Between 1994 <strong>and</strong> 2005, the use <strong>of</strong>probation for adjudicated person<strong>of</strong>fense cases increased for all racialgroups: from 58% to 65% for whiteyouth, from 53% to 60% for blackyouth, from 48% to 63% for Asianyouth, <strong>and</strong> from 47% to 60% forAmerican Indian youth.In 2005, among white youth, drug<strong>of</strong>fense cases that were adjudicateddelinquent were most likely to beplaced on formal probation (67%),followed by adjudicated person <strong>and</strong>property <strong>of</strong>fense cases (65% <strong>and</strong>64%, respectively).Among cases involving black youthin 2005, adjudicated person <strong>and</strong>property <strong>of</strong>fense cases were mostlikely to be placed on formal probation(both 60%), followed by adjudicateddrug <strong>of</strong>fense cases (57%).In 2005, for cases involvingAmerican Indian youth, adjudicateddrug <strong>of</strong>fense cases were most likelyto be placed on formal probation(72%), followed by adjudicated person(60%) <strong>and</strong> property <strong>of</strong>fensecases (58%).For cases involving Asian youth in2005, drug <strong>of</strong>fense cases that wereadjudicated delinquent were mostlikely to be placed on formal probation(67%).<strong>Juvenile</strong> <strong>Court</strong> <strong>Statistics</strong> 2005 57


![Chapter 5 [PDF] - Office of Juvenile Justice and Delinquency ...](https://img.yumpu.com/46584340/1/190x245/chapter-5-pdf-office-of-juvenile-justice-and-delinquency-.jpg?quality=85)