Juvenile Court Statistics 2005. - Office of Juvenile Justice and ...
Juvenile Court Statistics 2005. - Office of Juvenile Justice and ...
Juvenile Court Statistics 2005. - Office of Juvenile Justice and ...
- No tags were found...

Create successful ePaper yourself
Turn your PDF publications into a flip-book with our unique Google optimized e-Paper software.
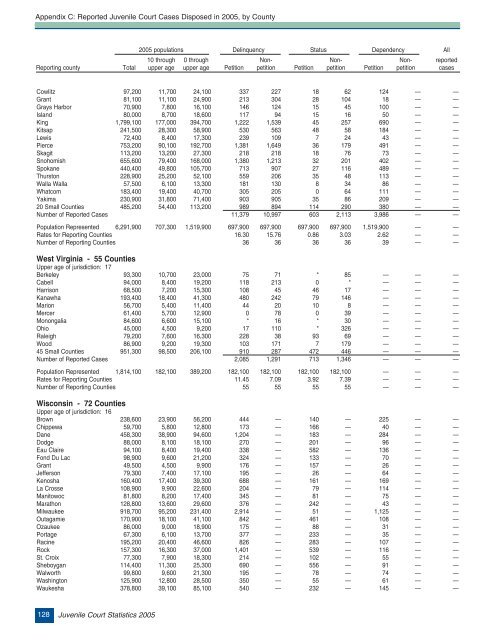
Appendix C: Reported <strong>Juvenile</strong> <strong>Court</strong> Cases Disposed in 2005, by County2005 populations Delinquency Status Dependency All10 through 0 through Non- Non- Non- reportedReporting county Total upper age upper age Petition petition Petition petition Petition petition casesCowlitz 97,200 11,700 24,100 337 227 18 62 124 — —Grant 81,100 11,100 24,900 213 304 28 104 18 — —Grays Harbor 70,900 7,800 16,100 146 124 15 45 100 — —Isl<strong>and</strong> 80,000 8,700 18,600 117 94 15 16 50 — —King 1,799,100 177,000 394,700 1,222 1,539 45 257 690 — —Kitsap 241,500 28,300 58,900 530 563 48 58 184 — —Lewis 72,400 8,400 17,300 239 109 7 24 43 — —Pierce 753,200 90,100 192,700 1,381 1,649 36 179 491 — —Skagit 113,200 13,200 27,300 218 218 18 76 73 — —Snohomish 655,600 79,400 168,000 1,380 1,213 32 201 402 — —Spokane 440,400 49,800 105,700 713 907 27 116 489 — —Thurston 228,900 25,200 52,100 559 206 35 48 113 — —Walla Walla 57,500 6,100 13,300 181 130 8 34 86 — —Whatcom 183,400 19,400 40,700 305 205 0 64 111 — —Yakima 230,900 31,800 71,400 903 905 35 86 209 — —20 Small Counties 485,200 54,400 113,200 989 894 114 290 380 — —Number <strong>of</strong> Reported Cases 11,379 10,997 603 2,113 3,986 — —Population Represented 6,291,900 707,300 1,519,900 697,900 697,900 697,900 697,900 1,519,900 — —Rates for Reporting Counties 16.30 15.76 0.86 3.03 2.62 — —Number <strong>of</strong> Reporting Counties 36 36 36 36 39 — —West Virginia - 55 CountiesUpper age <strong>of</strong> jurisdiction: 17Berkeley 93,300 10,700 23,000 75 71 * 85 — — —Cabell 94,000 8,400 19,200 118 213 0 * — — —Harrison 68,500 7,200 15,300 108 45 46 17 — — —Kanawha 193,400 18,400 41,300 480 242 79 146 — — —Marion 56,700 5,400 11,400 44 20 10 8 — — —Mercer 61,400 5,700 12,900 0 78 0 39 — — —Monongalia 84,600 6,600 15,100 * 16 * 30 — — —Ohio 45,000 4,500 9,200 17 110 * 326 — — —Raleigh 79,200 7,600 16,300 228 38 93 69 — — —Wood 86,900 9,200 19,300 103 171 7 179 — — —45 Small Counties 951,300 98,500 206,100 910 287 472 446 — — —Number <strong>of</strong> Reported Cases 2,085 1,291 713 1,346 — — —Population Represented 1,814,100 182,100 389,200 182,100 182,100 182,100 182,100 — — —Rates for Reporting Counties 11.45 7.09 3.92 7.39 — — —Number <strong>of</strong> Reporting Counties 55 55 55 55 — — —Wisconsin - 72 CountiesUpper age <strong>of</strong> jurisdiction: 16Brown 238,600 23,900 56,200 444 — 140 — 225 — —Chippewa 59,700 5,800 12,800 173 — 166 — 40 — —Dane 458,300 38,900 94,600 1,204 — 183 — 284 — —Dodge 88,000 8,100 18,100 270 — 201 — 96 — —Eau Claire 94,100 8,400 19,400 338 — 582 — 136 — —Fond Du Lac 98,900 9,600 21,200 324 — 133 — 70 — —Grant 49,500 4,500 9,900 176 — 157 — 26 — —Jefferson 79,300 7,400 17,100 195 — 26 — 64 — —Kenosha 160,400 17,400 39,300 688 — 161 — 169 — —La Crosse 108,900 9,900 22,600 204 — 79 — 114 — —Manitowoc 81,800 8,200 17,400 345 — 81 — 75 — —Marathon 128,800 13,600 29,600 376 — 242 — 43 — —Milwaukee 918,700 95,200 231,400 2,914 — 51 — 1,125 — —Outagamie 170,900 18,100 41,100 842 — 461 — 108 — —Ozaukee 86,000 9,000 18,900 175 — 88 — 31 — —Portage 67,300 6,100 13,700 377 — 233 — 35 — —Racine 195,200 20,400 46,600 826 — 283 — 107 — —Rock 157,300 16,300 37,000 1,401 — 539 — 116 — —St. Croix 77,300 7,900 18,300 214 — 102 — 55 — —Sheboygan 114,400 11,300 25,300 690 — 556 — 91 — —Walworth 99,800 9,600 21,300 195 — 78 — 74 — —Washington 125,900 12,800 28,500 350 — 55 — 61 — —Waukesha 378,800 39,100 85,100 540 — 232 — 145 — —128<strong>Juvenile</strong> <strong>Court</strong> <strong>Statistics</strong> 2005


![Chapter 5 [PDF] - Office of Juvenile Justice and Delinquency ...](https://img.yumpu.com/46584340/1/190x245/chapter-5-pdf-office-of-juvenile-justice-and-delinquency-.jpg?quality=85)