Juvenile Court Statistics 2005. - Office of Juvenile Justice and ...
Juvenile Court Statistics 2005. - Office of Juvenile Justice and ...
Juvenile Court Statistics 2005. - Office of Juvenile Justice and ...
- No tags were found...

Create successful ePaper yourself
Turn your PDF publications into a flip-book with our unique Google optimized e-Paper software.
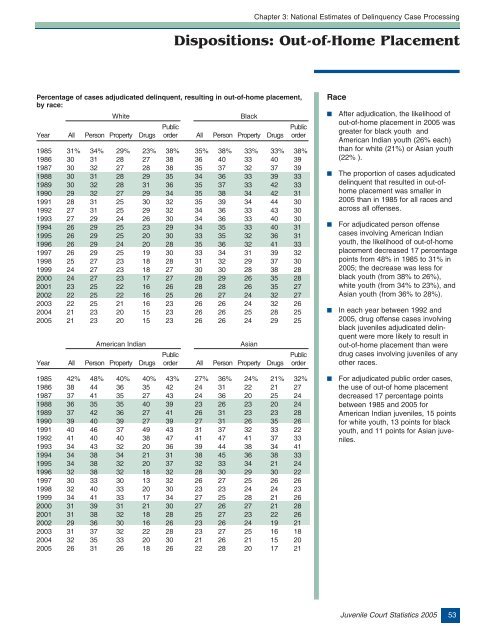
Chapter 3: National Estimates <strong>of</strong> Delinquency Case ProcessingDispositions: Out-<strong>of</strong>-Home PlacementPercentage <strong>of</strong> cases adjudicated delinquent, resulting in out-<strong>of</strong>-home placement,by race:WhiteBlackPublicPublicYear All Person Property Drugs order All Person Property Drugs order1985 31% 34% 29% 23% 38% 35% 38% 33% 33% 38%1986 30 31 28 27 38 36 40 33 40 391987 30 32 27 28 38 35 37 32 37 391988 30 31 28 29 35 34 36 33 39 331989 30 32 28 31 36 35 37 33 42 331990 29 32 27 29 34 35 38 34 42 311991 28 31 25 30 32 35 39 34 44 301992 27 31 25 29 32 34 36 33 43 301993 27 29 24 26 30 34 36 33 40 301994 26 29 25 23 29 34 35 33 40 311995 26 29 25 20 30 33 35 32 36 311996 26 29 24 20 28 35 36 32 41 331997 26 29 25 19 30 33 34 31 39 321998 25 27 23 18 28 31 32 29 37 301999 24 27 23 18 27 30 30 28 38 282000 24 27 23 17 27 28 29 26 35 282001 23 25 22 16 26 28 28 26 35 272002 22 25 22 16 25 26 27 24 32 272003 22 25 21 16 23 26 26 24 32 262004 21 23 20 15 23 26 26 25 28 252005 21 23 20 15 23 26 26 24 29 25American IndianAsianPublicPublicYear All Person Property Drugs order All Person Property Drugs orderRace■■■■After adjudication, the likelihood <strong>of</strong>out-<strong>of</strong>-home placement in 2005 wasgreater for black youth <strong>and</strong>American Indian youth (26% each)than for white (21%) or Asian youth(22% ).The proportion <strong>of</strong> cases adjudicateddelinquent that resulted in out-<strong>of</strong>homeplacement was smaller in2005 than in 1985 for all races <strong>and</strong>across all <strong>of</strong>fenses.For adjudicated person <strong>of</strong>fensecases involving American Indianyouth, the likelihood <strong>of</strong> out-<strong>of</strong>-homeplacement decreased 17 percentagepoints from 48% in 1985 to 31% in2005; the decrease was less forblack youth (from 38% to 26%),white youth (from 34% to 23%), <strong>and</strong>Asian youth (from 36% to 28%).In each year between 1992 <strong>and</strong>2005, drug <strong>of</strong>fense cases involvingblack juveniles adjudicated delinquentwere more likely to result inout-<strong>of</strong>-home placement than weredrug cases involving juveniles <strong>of</strong> anyother races.1985 42% 48% 40% 40% 43% 27% 36% 24% 21% 32%1986 38 44 36 35 42 24 31 22 21 271987 37 41 35 27 43 24 36 20 25 241988 36 35 35 40 39 23 26 23 20 241989 37 42 36 27 41 26 31 23 23 281990 39 40 39 27 39 27 31 26 35 261991 40 46 37 49 43 31 37 32 33 221992 41 40 40 38 47 41 47 41 37 331993 34 43 32 20 36 39 44 38 34 411994 34 38 34 21 31 38 45 36 38 331995 34 38 32 20 37 32 33 34 21 241996 32 38 32 18 32 28 30 29 30 221997 30 33 30 13 32 26 27 25 26 261998 32 40 33 20 30 23 23 24 24 231999 34 41 33 17 34 27 25 28 21 262000 31 39 31 21 30 27 26 27 21 282001 31 38 32 18 28 25 27 23 22 262002 29 36 30 16 26 23 26 24 19 212003 31 37 32 22 28 23 27 25 16 182004 32 35 33 20 30 21 26 21 15 202005 26 31 26 18 26 22 28 20 17 21■For adjudicated public order cases,the use <strong>of</strong> out-<strong>of</strong> home placementdecreased 17 percentage pointsbetween 1985 <strong>and</strong> 2005 forAmerican Indian juveniles, 15 pointsfor white youth, 13 points for blackyouth, <strong>and</strong> 11 points for Asian juveniles.<strong>Juvenile</strong> <strong>Court</strong> <strong>Statistics</strong> 2005 53


![Chapter 5 [PDF] - Office of Juvenile Justice and Delinquency ...](https://img.yumpu.com/46584340/1/190x245/chapter-5-pdf-office-of-juvenile-justice-and-delinquency-.jpg?quality=85)